PDF-Drunk Driving NEW JERSEYKeep New Jersey safe. Keep drunk drivers off T
Author : pamella-moone | Published Date : 2016-11-28
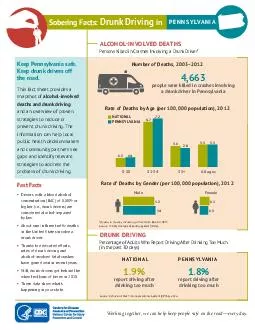
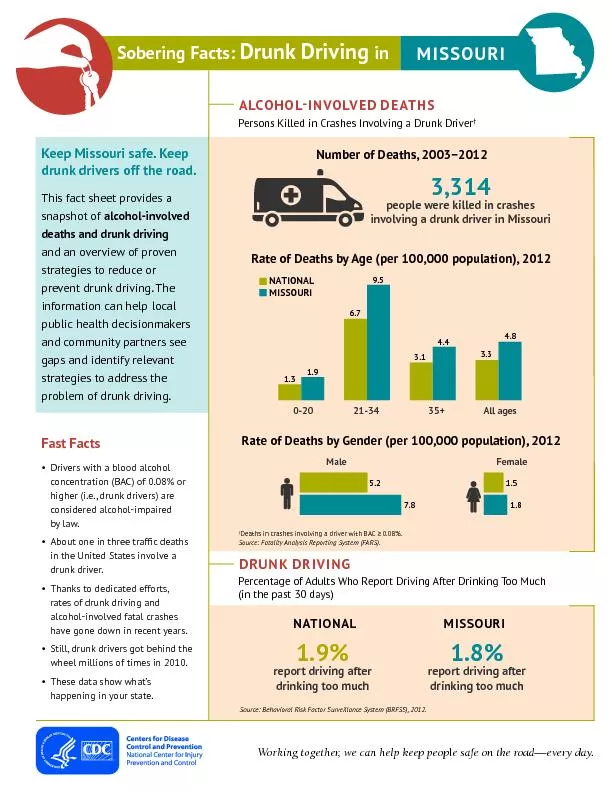
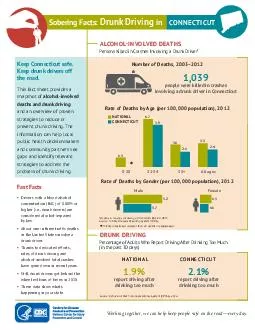
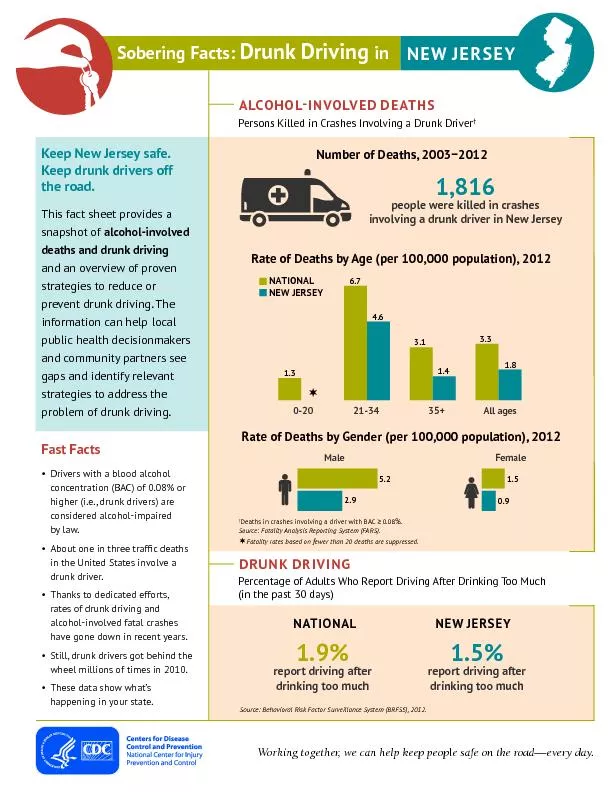
people were killed in crashes involving a drunk driver in New JerseyRate of Deaths by Age per 100000 population 2012 NATIONAL NEW JERSEY13 02067 46 213431 14 3533 18 All
Presentation Embed Code
Download Presentation
Download Presentation The PPT/PDF document "Drunk Driving NEW JERSEYKeep New Jersey ..." is the property of its rightful owner. Permission is granted to download and print the materials on this website for personal, non-commercial use only, and to display it on your personal computer provided you do not modify the materials and that you retain all copyright notices contained in the materials. By downloading content from our website, you accept the terms of this agreement.
Drunk Driving NEW JERSEYKeep New Jersey safe. Keep drunk drivers off T: Transcript
Download Rules Of Document
"Drunk Driving NEW JERSEYKeep New Jersey safe. Keep drunk drivers off T"The content belongs to its owner. You may download and print it for personal use, without modification, and keep all copyright notices. By downloading, you agree to these terms.
Related Documents