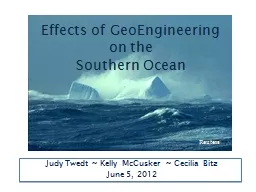
McCusker Cecilia Bitz June 5 2012 Effects of GeoEngineering on the Southern Ocean Reuters A Tale of Two Geoengineering Strategies increase the earths reflectance with stratospheric sulfate aerosols ID: 615796
Download Presentation The PPT/PDF document "Judy Twedt ~ Kelly" is the property of its rightful owner. Permission is granted to download and print the materials on this web site for personal, non-commercial use only, and to display it on your personal computer provided you do not modify the materials and that you retain all copyright notices contained in the materials. By downloading content from our website, you accept the terms of this agreement.
Slide1
Judy Twedt ~ Kelly McCusker ~ Cecilia BitzJune 5, 2012
Effects of
GeoEngineering on theSouthern Ocean
ReutersSlide2
A Tale of Two
Geoengineering Strategiesincrease the earth’s reflectance with stratospheric sulfate aerosolsremove greenhouse
gassesdecrease global mean surfacetemperatureincreased winds;more upwelling
Southern Ocean
b
arely cools
d
ecreased winds;
less upwelling
Southern Ocean Cools
f
easible
now
hypothetically feasibleSlide3
Increasing Albedo with Sulfate Aerosols(Kelly’s work)
Run RCP 8.5 emissions scenarios on CCSM4, with *full ocean dynamics*In 2035, increase Earth’s albedo by prescribing stratospheric concentrations of sulfate aerosols on top of RCP 8.5 greenhouse gasses
Compare with 20th Century Climatology (1970-1999)http://www.noaa.gov/features/protecting_0808/images/volcanoashcloud.jpgSlide4
RCP 8.5
McCusker, 2012Annual Mean Global
Temperature288 K
1960
2060Slide5
RCP 8.5
McCusker, 2012
Sulfate EngineeringAnnual Mean Global Temperature
288 K
1960
2060Slide6
RCP 8.5
McCusker, 2012Annual Mean
Global Temp (k)
Sulfate Engineering
Shut-Off
288 K
1960
2060Slide7
RCP 8.5
McCusker, 2012Annual Mean Global
TemperatureSulfate Engineering
Shut-Off
1850 Reference
288 K
1960
2060Slide8
r
eturn to 1988
GHG concentrationsAnnual Mean Global Temperature288 K
1960
2060Slide9
r
eturn to 1988
GHG concentrationsAnnual Mean Global Temperature
288 K
1960
2060Slide10
Surface Temperature Differences (k)Annual Avg
of Sulfate Engineering (2045-2054) – 20th C (1970-1999)
Sulfates Cool the Arctic more than the Antarctic Slide11
Vertical Temperature Profile Annual
Avg of Sulfate Engineering (2045-2054) – 20th C (1970-1999)
pause Temperature DifferenceSulfates absorb sw radiation in the stratosphere and are confounded with greenhouse gases.
Result: a
poleward
shift in surface
westerlies
Slide12
Near Surface Winds Sulfate Engineering (2045-2054) – 20th C (1970-1999)
The change in the sulfate run is a
strengthening of existing Antarctic winds
i
ncreased westerlies
1970-1999 controlSlide13
Motivating QuestionsWhy didn’t the Southern Ocean cool?Are winds the culprit?
Does the combination of greenhouse gasses & sulfates increase the winds and induce warm water upwelling in the Southern Ocean? Slide14
Modeling Wish Fulfillment (Greenhouse Gas Removal) I ran a branch from the RCP 8.5 scenario In 2035, dropped the GHG emissions to 1988 concentrations; ran 50 years
Prescribed Greenhouse Gas Concentrations
CO2 concentrations of 350 ppm have been proposed as target concentration by Hansen et. al., 2008CO2
CH
4
N
2
O
CFC-11
CFC-12
350
ppmSlide15
Return to 1988 concentrations
(just a reminder)
sulfate geoengineering
2045 – 2054
climatologySlide16
Surface Temperature DifferenceAnnual
Avg (2045 – 2054) of GHG Removal – Sulfate Engineering
Although the global mean surface temp is warmer, the Southern Ocean surface is already cooler! Slide17
Wind Stress Difference
Annual Avg (2045 – 2054) of GHG Removal – Sulfate Engineering
surface westerlies over Antarctica are weaker with greenhouse gas removalSlide18
Zonal Avg Ekman Pumping
Upwelling
*negative*Antarctica
Downwelling
*positive*
‘zero-line’ of the
greenhouse gas removal run is
NORTH
of the sulfate run
90 S
44 SSlide19
Comparison of CCSM4 Cooling Scenarios Stratospheric SulfatesRapid reduction in global
mean surface tempIncreased westerlies over the Southern Ocean – more upwelling, more heating from belowNot a viable means of protecting the Antarctic ice sheet
Greenhouse Gas RemovalReduction in global mean surface tempDecreased Ekman pumpingEkman transport shifts northwardCooling over the Southern OceanSlide20
Next StepsDig deeper into the ocean data and look at the subsurface ocean responseProbe the response rate: how does the Southern Ocean respond so quickly?
Remove MORE greenhouse gasses: simulate a return to pre-industrial forcing? ? ? ?Slide21
I’d like to thankKelly McCusker and Cecilia Bitz for their help and terrific feedback.
That said, any errors are my own. Slide22
xkcd.com/154