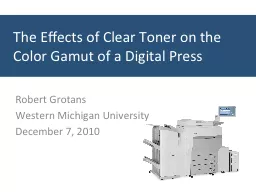
/
The Effects of Clear Toner on the Color Gamut of a Digital The Effects of Clear Toner on the Color Gamut of a Digital

The Effects of Clear Toner on the Color Gamut of a Digital - PowerPoint Presentation

pamella-moone
pamella-moone . @pamella-moone
Follow
388 views
Uploaded On 2017-04-27

The Effects of Clear Toner on the Color Gamut of a Digital - PPT Presentation

Robert Grotans Western Michigan University December 7 2010 Overview Background Experimental Results Conclusion Understanding Color Illuminant Sample Spectrum Standard Observer What is Color Gamut ID: 541866

clear toner test sample toner clear sample test color chart profiling profile substrate gamut lab conclusion gloss text print

Share:

Link:

Embed:

Download Presentation from below link

Download Presentation The PPT/PDF document "The Effects of Clear Toner on the Color ..." is the property of its rightful owner. Permission is granted to download and print the materials on this web site for personal, non-commercial use only, and to display it on your personal computer provided you do not modify the materials and that you retain all copyright notices contained in the materials. By downloading content from our website, you accept the terms of this agreement.


Presentation Transcript

Slide1

The Effects of Clear Toner on the Color Gamut of a Digital Press

Robert Grotans

Western Michigan University

December 7, 2010Slide2

Overview

Background

Experimental

Results

ConclusionSlide3

Understanding Color

Illuminant + Sample Spectrum + Standard ObserverSlide4

What is “Color Gamut”?

1931 x, y Chromaticity DiagramSlide5

Profiling1. Calibrate your device2. Print, display, or scan a test chart

3. Measure the test chart4. Use profiling software5. Produce a profileSlide6

Experimental

List of Substrates

Substrate

Name

GSM

1

20# Hammermill Bond

75

2

24# Beckett Writing (super smooth)

90

3

60# Husky Opaque Offset

89

4

60# 4CC Storaenso Cover

160

5

80# Sappi Flo Gloss Digital Text

118Slide7

1. Calibrate The DeviceShading CorrectionGradation Auto AdjustFiery RIP CalibrationSlide8

2. Print a Test Chart

ECI2002R CMYK test chartSlide9

3. Measure the Test ChartSlide10

4. Use Profiling SoftwareSlide11

5. Produce a ProfileInstall profileVerify profile for accuracySlide12

Analysis

Gamut ComparisonLAB Value Comparison(39.79, 15.83, 18.12)(44.01, 16.07, 17.5)Slide13

GretagMacbeth™ ColorChecker Slide14

CalculationsΔE = √(L1

-L2)2 + (a1-a2)2 + (b1-b2)2 = √(39.79-L2

)2 + (15.83-a2

)

2

+ (18.12-b

2

)2 = √(39.79-44.01)

2 + (15.83-16.07)2 + (18.12-17.5)2

ΔE = 4.27

ΔL = (L1-L2) =(39.79-44.01) = -4.22ΔC = √(a12+b12) - √(a2

2+b22) = √(15.832

+18.122) - √(16.072+(-17.5)2

) = 0.3Slide15

Sample 1 – 20# Hammermill Bond

Without 312,879

With 228,669Slide16

Sample 2 – 24# Beckett Writing

Without 322,846

With 255,525Slide17

Sample 3 – 60# Husky Offset

Without 338,949

With 239,272Slide18

Sample 4 – 60# Cover

Without 404,957

With 267,681Slide19

Sample 5 – 80# Gloss Text

Without 330,186

With 242,463Slide20

LAB Values

Clear Toner Over Vs. Clear Toner Under

Substrate

ΔE

Δ

L

Δ

C

1

3.18

-1.87

1.08

2

2.47

-1.19

0.31

3

1.54

-0.06

0.17

4

3.11

-1.88

0.74

5

2.15

-0.58

1.15Slide21

LAB Values

Without Clear Toner Vs. Clear Toner Over

Substrate

ΔE

Δ

L

Δ

C

1

4.78

-0.59

-3.20

2

4.60

-2.46

-3.01

3

7.22

-1.65

-4.29

4

6.86

-1.74

-3.68

5

4.75

-1.42

-2.81Slide22

ConclusionNot a lot of difference between clear toner over or underClear toner originally reduced the color gamut by 20-35%Knowledge gained

Recommendations

PaperOriginal Clear TonerNew Clear Toner

94.7, 2.1, -7

88.3, 1.8,-6.2

92.1, 2.1, -6.7Slide23

Special ThanksMark Gundlach and Michelle DeFouw, X-RiteDr. FlemingPCI DepartmentSlide24

Thank You!

Questions?