PDF-Environmental Burden of Disease Series, No. 7 Kyle Steenland Annette P
Author : pasty-toler | Published Date : 2016-05-03
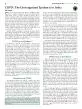
World Health Organization Protection of the Human Environment Geneva 2004 Occupational airborne particulates Preface
Presentation Embed Code
Download Presentation
Download Presentation The PPT/PDF document "Environmental Burden of Disease Series, ..." is the property of its rightful owner. Permission is granted to download and print the materials on this website for personal, non-commercial use only, and to display it on your personal computer provided you do not modify the materials and that you retain all copyright notices contained in the materials. By downloading content from our website, you accept the terms of this agreement.
Environmental Burden of Disease Series, No. 7 Kyle Steenland Annette P: Transcript
Download Rules Of Document
"Environmental Burden of Disease Series, No. 7 Kyle Steenland Annette P"The content belongs to its owner. You may download and print it for personal use, without modification, and keep all copyright notices. By downloading, you agree to these terms.
Related Documents