/
Revisiting the Adjustor Curves Revisiting the Adjustor Curves

Revisiting the Adjustor Curves - PowerPoint Presentation

pasty-toler
pasty-toler . @pasty-toler
Follow
351 views
Uploaded On 2018-12-18

Revisiting the Adjustor Curves - PPT Presentation

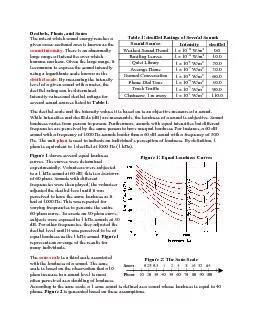
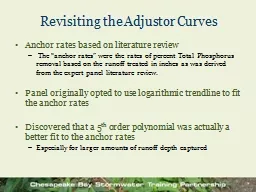
Anchor rates based on literature review The anchor rates were the rates of percent Total Phosphorus removal based on the runoff treated in inches as was derived from the expert panel literature review ID: 743230

panel curves anchor polynomial curves panel polynomial anchor rates report urban expert state trendline log stormwater reflects reflect equations faq document guidance

Share:

Link:

Embed:

Download Presentation from below link

Download Presentation The PPT/PDF document "Revisiting the Adjustor Curves" is the property of its rightful owner. Permission is granted to download and print the materials on this web site for personal, non-commercial use only, and to display it on your personal computer provided you do not modify the materials and that you retain all copyright notices contained in the materials. By downloading content from our website, you accept the terms of this agreement.


Presentation Transcript

Slide1

Revisiting the Adjustor Curves

Anchor rates based on literature review

The “anchor rates” were the rates of percent Total Phosphorus removal based on the runoff treated in inches as was derived from the expert panel literature review.

Panel originally opted to use logarithmic

trendline

to fit the anchor rates

Discovered that a 5

th

order polynomial was actually a better fit to the anchor rates

Especially for larger amounts of runoff depth capturedSlide2
Slide3

So??

Expert Panel report still reflects the log curve

Trendline

equations

in the FAQ document reflect the polynomial curve

Several state guidance documents use the curves from the panel report which reflects the “old” curves (log)Slide4

Next Steps

Recommend USWG makes a decision on which curves to use going forward

Need for consistency in the guidance being distributed

Implications:

Logarithmic: changes to the

trendline

equations in the FAQ document (and some associated training materials)

Polynomial: the expert panel report should be revised to reflect

Model currently uses

polynomial

curves; if changed to log could not be

reflected until 2015Slide5

Urban BMP FactsheetsSlide6

Fact Sheet Topics

Basics of

Ches

Bay Pollutant Reduction Plans

Stormwater Retrofits

Stormwater Practices for New and Redevelopment Projects

Stream Restoration

Urban Nutrient Management

Erosion and Sediment Control

Residential BMPs (i.e. homeowner)

Septic Systems

Urban Filter StripsSlide7

Fact Sheet Contents

Practice Description

Best Places to Implement Them in Your Community

How to Find & Rank Candidate Sites

General Cost Estimation

What Technical Support is Needed

Brief Summary of How to Compute Credits

Add’l

Community Benefits Provided

What to Report to State/Local Records to Keep

How to Verify Practice in Future

State Specific Info and contacts