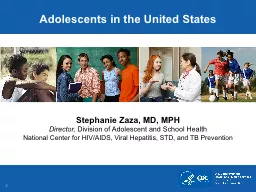
Stephanie Zaza MD MPH Director Division of Adolescent and School Health National Center for HIVAIDS Viral Hepatitis STD and TB Prevention Defining Adolescence Developmental stage Physical intellectual emotional and psychological changes ID: 625272
Download Presentation The PPT/PDF document "Adolescents in the United States" is the property of its rightful owner. Permission is granted to download and print the materials on this web site for personal, non-commercial use only, and to display it on your personal computer provided you do not modify the materials and that you retain all copyright notices contained in the materials. By downloading content from our website, you accept the terms of this agreement.
Slide1
Adolescents in the United States
Stephanie Zaza, MD, MPHDirector, Division of Adolescent and School HealthNational Center for HIV/AIDS, Viral Hepatitis, STD, and TB PreventionSlide2
Defining AdolescenceDevelopmental stagePhysical, intellectual, emotional, and psychological changes
Puberty and maturation occurCorresponding years Pre-teen and teenage yearsMiddle school and high school yearsAssociated age range Varies by organizationToday’s presentation: 10–19 yearsSlide3
Racial and Ethnic Distribution of U.S. Adolescents, Ages 10–19 Years
US Census Bureau, 2013 estimates, accessed June 3, 2015White
Other
Hispanic and Latino
Black
41,844,000 adolescents, 13% of U.S. populationSlide4
School Enrollment and Dropout Rate of U.S. Adolescents
37,765,000 students are enrolled Dropout rate: 7%White: 5%Black: 9%Hispanic: 13%US Census Bureau, Current Population Survey, 2012http://nces.ed.gov/pubs2015/2015144.pdf
Dropout Rate
Noninstitutionalized 16 to 24-year-olds
Not enrolled in high
school Without a high school diploma or GEDSlide5
Many U.S. Adolescents Are in Low-income Families
http://nccp.org/publications/images/age12-17-2015-fig1.png
Low Income = 40%
Federal
Poverty Threshold (FPT)
Near Poor = 100–199% FPTPoor < 100%
FPTSlide6
Homelessness Among U.S. Adolescents500,000 to 2.8 million youth are homeless per year1.6 million adolescents ran away, 200212–13
years: 24%14–15 years: 30%16–17 years: 46%http://assets.opencrs.com/rpts/RL31933_20060323.pdfhttp://www.samhsa.gov/data/2k4/runaways/runaways.pdf Slide7
Indicator
PercentHealth is excellent, very good, or good
97%
Limitation of activity due to health issue
11%
Overall Health Status of U.S. Adolescents
National
Health Interview
Survey, 2012
Park
MJ, et
al
.
Journal
of Adolescent
Health, 2014Slide8
Leading Causes of Death
U.S. Adolescents, 2013
Cause of Death
Number
of Deaths
All Causes
12,393
Unintentional Injury
4,427
Suicide
2,134
Homicide
1,559
Malignant Neoplasms
1,075
Heart Disease
397
Congenital
Anomalies
327
Chronic Low Respiratory Disease
140
Influenza and
Pneumonia
134
Cerebrovascular
104
Diabetes Mellitus
72
All Others
2,024
CDC, WISQARS accessed 8/13/2015Slide9
Indicator
EstimateUnintentional injuries (10–19 years)4,373,717
Nonsexual assault (10–19 years
) 260,949
Suicide attempt (9th
–12th grade)8%
Births
(15–19
years)
273,000
Chlamydia
(15–19 years)
395,612
Gonorrhea
(15–19 years)
72,092
Asthma
(0–17 years)
10%
Overweight
(95%>BMI
>
85
th
%)
(
12–19 years
)
14%
Obese
(BMI
>
95th%)
(
12–19 years
)
21%
Nonfatal Health Outcomes
U.S. Adolescents
National
Electronic Injury Surveillance System, 2013Youth Risk Behavior Survey, 2013CDC Vital Signs: Preventing Teen PregnancyCDC STD Surveillance Statistics, 2013CDC Vital Signs: Asthma in the US, 2011National Health and Nutrition Examination Survey, 2011-2012Slide10
Health Care Access and Use Among U.S. Adolescents
U.S. Census Bureau, Current Population Survey, 2013National Committee for Quality Assurance, Healthcare Effectiveness Data and Information Set, 2013Slide11
Risk Behaviors of Adolescents
Injury Risk BehaviorsPercentRarely or never wear a bicycle helmet88%Text or email while driving a car
41%
In a physical fight
25%
Obesity and Chronic Disease Risk BehaviorsAt least 60 minutes of
physical
activity daily
27%
Use computers for
3
or more hours per day (non-school work)
41%
Eat breakfast
daily
38%
Youth
Risk Behavior
Survey, 2013Slide12
More Risk Behaviors of Adolescents
Sexual and Reproductive Health Risk BehaviorsPercentAmong sexually active females, not using IUD or implant98%Among sexually active, not using a condom
41%
Substance Use Risk Behaviors
Currently use alcohol
35%Currently use marijuana23%
Currently use tobacco (all forms)
22%
Youth
Risk Behavior
Survey, 2013Slide13
Improving Trends in Risk Behavior Among Adolescents
Youth Risk Behavior Surveys, 1991–2013PercentSlide14
Adolescents Are Preparing for Lifelong Health and WellnessAdolescent population in the U.S. is large
and diverseSocioeconomically vulnerableAdolescents are in relatively good healthHealthcare access and utilization is highPreventive care is under-usedModifiable and preventable risk behaviors lead to mortality and morbidityContribute to current and future health riskAmenable to public health interventionSlide15
Prevention for a Moving Target
Patricia J. Dittus, PhDLead Behavioral Scientist Social and Behavioral Research and Evaluation Branch Division of STD Prevention
National Center for HIV/AIDS, Viral Hepatitis, STD, and TB Prevention Slide16
Three Stages of Adolescent Development
Three stages of adolescence
Early
adolescence,
ages
11–13
Middle
adolescence, ages 14–18
Late Adolescence,
ages 19–21
Three areas of development
Physical
Cognitive
Brains continue developing into late adolescence
Executive function – weighing long-term consequences and controlling impulses last to mature
Social-Emotional
Parent conflict
Peer influence
Adapted from the American Academy of Child and Adolescent’s Facts for Families,
2008Slide17
Intrapersonal
Institutional
Interpersonal
Community
Society and Policy
Multiple Levels of Influences on
Adolescent BehaviorSlide18
Intrapersonal
Intrapersonal or Individual-level Influences on Adolescent Behavior
Individual
attitudes, beliefs,
knowledge, and developmental
influences Slide19
Intrapersonal
Interpersonal
Interpersonal or Relationship-level
Influences
on Adolescent Behavior
Family
, peer, and
romantic relationshipsSlide20
Intrapersonal
Institutional
Interpersonal
Institutional-level
Influences
on Adolescent Behavior
Schools
and health care institutionsSlide21
Intrapersonal
Institutional
Interpersonal
Community
Community-level Influences
on Adolescent Behavior
Neighborhood
characteristics,
community resources,
and
normsSlide22
Intrapersonal
Institutional
Interpersonal
Community
Society and Policy
Society and
Policy-level Influences
on
Adolescent Behavior
Cultural
, policy,
and mediaSlide23
Parent-level Intervention: Families Talking Together (FTT)
Designed to improve communication between
parents and adolescents
Avoiding too early or risky sex
Program components
Brief face-to-face sessions
Nine written modules
Short booster calls to follow-up
Provider/school endorsement
Key parenting behaviors
Talk about sex
Monitor and supervise adolescent
Improve quality of parent-adolescent relationship
www.clafh.orgSlide24
Evaluation and Results of Families Talking Together
Two randomized clinical trials in New York City
1 in 5 public middle schools
One in community healthcare clinic
2,016 mother-adolescent dyads in school study
Follow-up conducted 12 months after intervention
Students in intervention schools reported
Increases in talking with their mothers about sex
Improved parental monitoring
Improved quality of relationship with mothers
Guilamo
-Ramos
V, et al. Journal of Adolescent Health, 2011 Slide25
Effective Parent-level Interventions Can Reduce Sexual Initiation in Adolescents
*p <.05FTT is endorsed by the HHS Office of Adolescent HealthGuilamo-Ramos V, et al. Journal of Adolescent Health, 2011
Impact of FTT
Sexual Behavior
Outcome
FTT Intervention
Baseline Follow-up
Control
Baseline Follow-up
Ever had vaginal intercourse
7%
7%
*
6%
22%
Average frequency of sex in
past
30 days
1.0
1.1
*
1.0
1.5
Slide26
School-level Intervention:Project Connect
Designed to increase use
of sexual and reproductive
healthcare
Connects
at-risk youth with
healthcare providers
In their community
Already providing recommended services
Develops provider referral guide
Trains key people in schools to make referrals
to providersSlide27
Evaluation and Results of Project ConnectEvaluated in 12 public high schools in the
Los Angeles Unified School DistrictSurveyed 29,823 students in five yearly cross-sectional samples76% Latino Average age was 16 years47% had already had sex at the start of the studyEffective for sexually experienced females, but not effective for males Adaptations are being evaluated to connect males to careSlide28
Increased STD Testing or Treatment in Sexually Experienced Females
Dittus P, et al.
Journal
of Adolescent Health, 2014 Project Connect is recommended as an effective strategy by Division of STD Prevention and by
Division of Adolescent and School Health, CDCSlide29
Community-level Intervention:Communities that Care (CTC)
www.sdrg.org/CTCInterventions.asphttp://www.communitiesthatcare.net/how-ctc-works/
Designed to reduce alcohol and tobacco
use, delinquency, and violence
Components include
Community-wide survey to assess risk and protective factors
Forming coalition of local stakeholders
Menu of effective interventions for families, schools,
and the community
Families (e.g., Strengthening Families 10-14)
Schools (e.g., Life Skills Training)
Communities (e.g., Stay Smart)
Ongoing evaluations and community assessments
of progress Slide30
Evaluation of Communities that Care (CTC):Community Youth Development Study
Randomized controlled trial In 7 states24 communities (12 matched pairs) Students surveyed annually4,407 5th gradersVariety of health risk behaviors, includingAlcohol useTobacco use, all typesDelinquency and violenceAnalysis controlled for baseline differences in prevalence, student- and community-level covariates
Hawkins JD, et al.
Archives of Pediatrics and Adolescent
Medicine, 2009Slide31
Communities that Care Reduced Use of Alcohol, Smokeless Tobacco, and Delinquency
Outcomes at Grade 8Communities that Care
Control Communities
Alcohol use (%)
in past 30 days
16*21
Smokeless tobacco (%)
in past 30 days
2
**
4
Binge drinking (%)
in past 2 weeks
6
*
9
Average number of delinquent
behaviors
in past year
0.8
**
1.1
*p
<.05; ** p<.
01
Communities that Care is a
SAMHSA evidenced-based
program
Hawkins JD, et al.
Archives of Pediatrics and Adolescent
Medicine
,
2009Slide32
Society and Policy-level Intervention: Graduated Driver Licensing (GDL) Systems
Graduated
Driver
Licensing
Learner’s permit
Provisional license
Regular driver’s
license
All states have GDL
laws with
these 3 graduated stages
Some have additional
restrictions, varies by state
Require parent or licensed adult to supervise
adolescents who drive
during
high-risk
hours
Nighttime curfew
Restrictions on number and ages of passengersSlide33
Evaluation of Graduated Driver Licensing (GDL) Systems
Fell JC, et al. Traffic Injury Prevention, 2011
Fatal crashes among drivers 16–17 years old were compared to fatal crashes among drivers 19–20 and
21–25 years old
GDL laws were rated
and those with 5 of 7
additional restrictions
were defined as “good”
Zero tolerance alcohol
laws were assessed too
Illegal
for persons under
age 21
to
drive with any amount
of
alcohol in their
systemSlide34
Graduated Driver Licensing (GDL) Systems Led to Fewer Fatal CrashesGDL programs reduced fatal crashes among
16- and 17-year-olds by 7%–14%, relative to older age groupsStates with good GDL laws had fewer fatal crashes Good = at least 5 of 7 additional componentsStates with good GDL laws and zero tolerance alcohol laws had fewest fatal crashesAdditional restrictions to GDL laws are importantFell JC, et al. Traffic Injury Prevention, 2011 Slide35
Intrapersonal
Institutional
Interpersonal
Community
Society and Policy
Using Multiple Interventions to Reach Adolescents
Healthy
Choice
= Easy
ChoiceSlide36
Schools as a Venue
for Promoting Health and Wellness
Shannon L. Michael, PhD, MPH
Health Scientist,
School Health BranchDivision of Population Health
National Center for Chronic Disease Prevention and Health PromotionSlide37
Why Schools? Slide38
How Can Schools Impact Adolescent Health?
CREATE A HEALTHY ENVIRONMENT
TEACH HEALTH EDUCATION & PHYSICAL EDUCATION
PROVIDE HEALTH SERVICES
Slide39
Aspects of Healthy School Environments
School climate is the quality and character of the schoolMotivates learningPrevents or reduces risk behaviorsSchool connectedness reflects relationships with peers, teachers, and parentsImproves academic achievement
Prevents
or reduces risk behaviors
Policies and practices should beHealth specific
Evidence-based
Thapa
A,
et al. Rev
Educ
Res, 2013
http://
www.cdc.gov/healthyyouth/protective/pdf/connectedness.pdf
MMWR
. 2011;60(RR-5):
1-76Slide40
Support Evidence-based Policies and Practices in Schools through Local School Wellness PoliciesDistrict
wellness policies address nutrition and physical activitySchools should ensure their policies and practices are evidence-basedCDC’s School Health Guidelines for Promoting Healthy Eating and Physical Activity9 evidence-based guidelines
33 evidence-based strategies
http
://www.cdc.gov/healthyyouth/npao/wellness.htm
MMWR 2011;60(RR-5):1-76Slide41
What is Happening?Nutrition Policies and Practices in Schools
Doing a Good Job…
Needs Improvement
…
Fewer than 20% of schools have vending machines, school stores, or snack bars that sell foods and beverages high in fat or added sugar
Only 6% of schools
have vending machines, school stores, or snack bars
that sell fruits or vegetables
Almost 75% of schools
permit students to carry a drinking water bottle during
the school day
Almost 25% of schools
allow soft drink companies to advertise soft drinks on
vending machines
School
Health Policies and Practices Study
2014, in press. Slide42
What is Happening?Nutrition Policies and Practices in Schools
Doing a Good Job…
Needs Improvement
…
Fewer than 20% of schools have vending machines, school
stores, or snack bars that sell foods and beverages high in fat
or added sugar
Only 6% of schools
have vending machines, school stores, or snack bars
that sell fruits or vegetables
Almost 75% of schools
permit students to carry a drinking water bottle during
the school day
Almost 25% of schools
allow soft drink companies to advertise soft drinks on
vending machines
School
Health Policies and Practices Study
2014, in press. Slide43
What is Happening?Nutrition Policies and Practices in Schools
Doing a Good Job…
Needs Improvement
…
Fewer than 20% of schools have vending machines, school stores, or snack bars that sell foods and beverages high in fat or added sugar
Only 6% of schools
have vending machines, school stores, or snack bars
that sell fruits or vegetables
Almost 75% of schools
permit students to carry a drinking water bottle during
the school day
Almost 25% of schools
allow soft drink companies to advertise soft drinks on
vending machines
School
Health Policies and Practices Study
2014, in press. Slide44
What is Happening?Nutrition Policies and Practices in Schools
Doing a Good Job…
Needs Improvement
…
Fewer than 20% of schools have vending machines, school stores, or snack bars that sell foods and beverages high in fat or added sugar.
Only 6% of schools
have vending machines, school stores, or snack bars
that sell fruits or vegetables
Almost 75% of schools
permit students to carry a drinking water bottle during
the school day
Almost 25% of schools
allow soft drink companies to advertise soft drinks on
vending machines
School
Health Policies and Practices Study
2014, in press. Slide45
What is Happening?Nutrition Policies and Practices in Schools
Doing a Good Job…
Needs Improvement
…
Fewer than 20% of schools have vending machines, school stores, or snack bars that sell foods and beverages high in fat or added sugar
Only 6% of schools
have vending machines, school stores, or snack bars
that sell fruits or vegetables
Almost 75% of schools
permit students to carry a drinking water bottle during
the school day
Almost 25% of schools
allow soft drink companies to advertise soft drinks on
vending machines
School
Health Policies and Practices Study
2014, in press. Slide46
What is Happening? Physical Activity Policies and Practices in Schools
Doing a Good Job…
Needs Improvement…
Almost 90% of schools
follow national, state, or
district
physical education standards
Only 4% of schools
provide daily physical education throughout the school year
Over
90%
of schools
with students in grades K–
5
have regularly scheduled recess
Only 45% of schools provide opportunities for students to take physical activity breaks outside of physical education class
School
Health Policies and Practices Study
2014, in press. Slide47
What is Happening? Physical Activity Policies and Practices in Schools
Doing a Good Job…
Needs Improvement…
Almost 90% of schools
follow national, state, or
district
physical education standards
Only 4% of schools
provide daily physical education throughout the school year
Over
90%
of schools
with students in grades K–
5
have regularly scheduled recess
Only 45% of schools provide opportunities for students to take physical activity breaks outside of physical education class
School
Health Policies and Practices Study
2014, in press. Slide48
What is Happening? Physical Activity Policies and Practices in Schools
Doing a Good Job…
Needs Improvement…
Almost 90% of schools
follow national, state, or
district
physical education standards
Only 4% of schools
provide daily physical education throughout the school year
Over
90%
of schools
with students in grades K–
5
have regularly scheduled recess
Only 45% of schools provide opportunities for students to take physical activity breaks outside of physical education class
School
Health Policies and Practices Study
2014, in press. Slide49
What is Happening? Physical Activity Policies and Practices in Schools
Doing a Good Job…
Needs Improvement…
Almost 90% of schools
follow national, state, or
district
physical education standards
Only 4% of schools
provide daily physical education throughout the school year
Over
90%
of schools
with students in grades K–
5
have regularly scheduled recess
Only 45% of schools provide opportunities for students to take physical activity breaks outside of physical education class
School
Health Policies and Practices Study
2014, in press. Slide50
Provide Heath Education and Physical EducationSlide51
Teach Students How to Be Healthy
Health educationIncreases knowledge about health and healthy behaviorsTeaches skills for practicing healthy behaviors Affects health behaviors
and outcomes
Increases condom useImproves BMI (body mass index)
Decreases smoking
MMWR 2011;60(RR-5):1-76 Flay, B.
Tobacco
Induced
Diseases, 2009
Vicinanza
N,
Niego
S, Park MJ, et al. (2008). Model programs for adolescent sexual health: Evidence-based HIV, STI,
and pregnancy
prevention interventions. (pp. 197-206
)Slide52
Equip Students to Be Physically Active
Physical educationProvides knowledge, skills, and confidence to be physically activeHelps adolescents get recommended 60 minutes of daily physical activity Students should have 225 minutesevery week of physical education in
middle and high schools
Students should spend at least 50% of class time engaged in
moderate–to–vigorous physical activity
http://www.nap.edu/catalog.php?record_id=18314 Slide53
Schools Can Adopt Enhanced Physical Education
In 2013, the Community Preventive Services Task Force recommended enhanced physical education Enhanced physical education increases the time students spend inmoderate-to-vigorous physical activity by
Improving teaching strategies through activity selection, class organization and management, and instruction
Encouraging teachers to supplement
students' participation in sports with moderate-vigorous activities National Initiatives
First Lady’s Let’s Move! Active Schools Presidential Youth Fitness Program
Task Force on Community Preventive Services. Am J
Prev
Med, 2002
Lonsdale
C,
et al.
Prev
Med, 2013
http://www.letsmoveschools.org/Slide54
Provide School Health ServicesSlide55
School-based Nursing Services Are Cost BeneficialMassachusetts
Essential School Health Services ProgramWang L, et al. JAMA Pediatr, 2014
Program Costs
Estimated Costs Averted (millions)
Net Benefit
Cost-
Benefit
Ratio
$79 Million
Medical care costs $20
Loss of parents’ productivity $28
Loss of teachers’ productivity $129
Total Costs Averted $177
$98 Million
1:2.2Slide56
Comprehensive School-Based Health Services Improve Adolescents’ Health
School-based health centers can provide comprehensive health servicesTask Force review found improvements in health-related outcomesVaccination and other preventive servicesAsthma morbidityEmergency department use and hospital admission
Contraceptive
use among femalesPrenatal care and birth weight
Alcohol consumption and illegal substance use
Task
Force: Community
Preventive Services Task Force
www.thecommunityguide.org/healthequity/education/schoolbasedhealthcenters.html.Slide57
Comprehensive School-Based Health Services Improve Adolescents’ Education
Task Force review found improvements in educational outcomes Grade point average Grade promotion Suspension ratesNon-completion rates
The Task Force recommends
implementation and maintenance of school-based health centers in
low-income communities
Task Force: Community Preventive Services Task Force
www.thecommunityguide.org/healthequity/education/schoolbasedhealthcenters.htmlSlide58
Denver School-Based Health Centers (SBHCs)
All 16 SBHCs provideSTD testing and treatmentComprehensive reproductive health educationPregnancy testing13 of 16 SBHCs dispense condoms and contraceptionConnect adolescents to community clinics with health educators
Evie Denis Campus, Denver, CO
http://www.denverhealth.org/medical-services/primary-care/our-services/school-based-health-centersSlide59
Denver School Drop-out Rates DropVital Statistics, Health Statistics Section, Colorado Department of Public Health and Environment,
CDC/NCHS, National Vital Statistic SystemDrop-out Rate Compared to Birth Rates for Denver Teens
7.5%
3.3%Slide60
Schools Can Impact Adolescent Behaviors to Improve Lifelong Health and Wellness
CREATE A HEALTHY ENVIRONMENTusing evidence-based policies and practices
TEACH HEALTH EDUCATION & PHYSICAL EDUCATION
t
o establish healthy behaviors
PROVIDE HEALTH SERVICES
either at the school or
off-siteSlide61
Health Care for Adolescents:
How to Improve ItClaire D. Brindis, DrPH
Professor of Pediatrics and Health Policy
Director,
Philip R. Lee Institute for Health Policy
StudiesCo-Project Director, Adolescent and Young Adult Health –
National
Resource Center
University
of California, San
FranciscoSlide62
How Can We Improve Health Care for Adolescents? Improve access to clinical preventive health s
ervices Use opportunities provided by the Affordable Care Act Design interventions within healthcare systems that improve population healthAssure health care is adolescent friendlySlide63
Challenges to Providing Care to Adolescents
Healthcare Effectiveness Data and Information Set (HEDIS) National Committee on Quality Assurance (NCQA) Guidelines: The State of Health Care Quality, 2013
HEDIS Measures for
Adolescents by Insurance Type, NCQA, 2013
Received Preventive CareSlide64
Can Adolescents Access Services?
Adams et al, 2015 citing MEPS, 2011Overall, 43% of adolescents had a past-year preventive health
visit
Low income < 100% of poverty
Full year uninsured
HispanicsNH-Black
NH-Whit
e
Males
Females
45%
Received Preventive Health VisitSlide65
Do Healthcare Visits Provide Anticipatory Guidance?
Anticipatory guidance includes screening and counseling for behaviors Healthcare providers can identify adolescent strengths and risksSome adolescents receive anticipatory guidance Fewer than 1 in 3 counseled on using seat belts, helmets and dangers of secondhand smokeFewer than 1 in 2 counseled on healthy eatingOnly 1 out of 10 adolescents had all 6 recommended prevention topics addressed
Irwin
CE Jr, Adams SH, Park MJ, Newacheck PW. Pediatrics, 2009Slide66
The Promise of the Affordable Care Act
Insurance coverageDesignated medical homeAccess to preventive servicesTransition to adult care
Closing the Insurance and Healthcare GapSlide67
1. Insurance CoverageMedicaid expansionHealth insurance exchanges
Subsidies and cost sharingDependent coverageSlide68
2. Designated
Medical HomeIrwin CE Jr, Adams SH, Park MJ, Newacheck PW. Pediatrics, 2009 Adams SH, et
al.
Acad Pediatr, 2013
National Health Interview Survey
2010
Improves
coordination and continuity of care by
Increasing access to care
Reducing fragmentation of care
54%
of adolescents received
care in a medical home
Among
those with a mental health
condition, only 46% did
Among
those with
a
mental health
condition AND a physical
health condition, only 35
%
didSlide69
3. Access to Preventive ServicesProvided by plans without
cost sharing to membersRequirements established by US Preventive Services Task Force, “A” and “B”Bright Futures GuidelinesACIP Immunization RecommendationsInstitute of Medicine Recommendations for Women’s Health Services must be administered by a provider within the healthcare network
https://
brightfutures.aap.orgSlide70
4. Transition to Adult Care
Medical homes provide systematic transition to adult careOpportunity for adolescents to grow into active consumers of health careNavigation skillsInformed health consumers Health literacySelf-advocacySlide71
Challenges to the Promise of Affordable Care Act
Failure of adolescents to enroll in health insuranceFailure to seek annual preventive health visitsLack of access in non-Medicaid-expansion statesFailure to seek sensitive services due to privacy concernsSexual and reproductive health services
Substance use servicesMental health servicesSlide72
Healthcare System Interventions Can Be Designed to Improve Adolescent Health
Data showed potential to increase preventive services for adolescentsIntervention designed to integrate screening and counseling into clinic culturePediatricians and Nurse Practitioners trained to screen and counsel adolescentsSpecific screening questions and scripts tailored to adolescent risk behaviors
Affirm positive health behaviors
Anticipatory guidance for risk behaviors Reinforcement by other members of healthcare team
Ozer EM, et al. Pediatrics, 2005Slide73
Clinician and System Intervention Led to More Adolescents Screened and Counseled
INTERVENTION
COMPARISON
Pre-training
Post-training
Pre-training
Post-training
Screened
Seat
belt use
43
%
82%*
51%
47%*
Helmet
use
42
%
81%*
30%
30
%
Total
58
%
83
%*
53%
52
%
Counseled
Seat
belt use
44
%
85%*
46%
54
%*
Helmet
use
39
%
81%*
35%
46%*
Total
54%
82
%*
46%
51
%*
*p
< .
001
Ozer EM, et al. Pediatrics, 2005Slide74
Clinician and System Intervention Led to More Adolescents Being Screened and Counseled
INTERVENTION
COMPARISON
Pre-training
Post-training
Pre-training
Post-training
Screened
Seat
belt use
43
%
82%*
51%
47%*
Helmet
use
42
%
81%*
30%
30
%
Total
58
%
83
%*
53%
52
%
Counseled
Seat
belt use
44
%
85%*
46%
54
%*
Helmet
use
39
%
81%*
35%
46%*
Total
54%
82
%*
46%
51
%*
*p
< .
001
Ozer EM, et al. Pediatrics, 2005Slide75
Clinician and System Intervention Led to More Adolescents Being Screened and Counseled
INTERVENTION
COMPARISON
Pre-training
Post-training
Pre-training
Post-training
Screened
Seat
belt use
43
%
82%*
51%
47%*
Helmet
use
42
%
81%*
30%
30
%
Total
58
%
83
%*
53%
52
%
Counseled
Seat
belt use
44
%
85%*
46%
54
%*
Helmet
use
39
%
81%*
35%
46%*
Total
54%
82
%*
46%
51
%*
*p
< .
001
Ozer EM, et al. Pediatrics, 2005Slide76
Clinician and System Intervention Led to More Adolescents Being Screened and Counseled
INTERVENTION
COMPARISON
Pre-training
Post-training
Pre-training
Post-training
Screened
Seat
belt use
43
%
82%*
51%
47%*
Helmet
use
42
%
81%*
30%
30
%
Total
58
%
83
%*
53%
52
%
Counseled
Seat
belt use
44
%
85%*
46%
54
%*
Helmet
use
39
%
81%*
35%
46%*
Total
54%
82
%*
46%
51
%*
*p
< .
001
Ozer EM, et al. Pediatrics, 2005Slide77
Why
Such Progress After Training
?
Critical
Ingredients to Intervention’s Success
Support from Chief and other system championsOutpatient DirectorDirector of NursingHealth educators, lead clerksPartnerships forged between
external experts and
health
plan
experts
All
trained at
same time
Patient
Support
Materials integrated
Focus on clinic-wide
implementation with fidelity to intervention design led to change
in culture Slide78
Increases in Safety Among Adolescents After Screening and Counseling
Intervention
Comparison Sample:
Pediatric Cohort Sample, for Safety
Year 1
Year 2
Year 1
Year 2
Safety
Age 14
N = 904
Age 15
N = 904
Age 14
N = 311
Age 15
N = 268
Seatbelt
(Use 100% of
the time)
51%
60%+
49%
54%
Helmet Use
(Use 100% of
the time)
17%
24%*
14%
11%
INTERVENTION
COMPARISON
Safety
Measure
Year 1
Year 2
Year 1
Year 2
Age 14
Age 15
Age 14
Age 15
Seat belt
use 100%
51%
60%+
49%
54%*
Helmet
use
100%
17%
24%*
14%
11%
*p
< .
05
+p <.10-.14
Ozer EM, et al. Pediatrics, 2005Slide79
General Principles of Youth-friendly Health Care
Availability—Appointment wait time is reasonableAppropriateness—Care is tailored to adolescents’ needs
Accessibility—
Transportation is available and easy to useApproachability—
Center and staff are welcoming
Acceptability—Staff show respect and are nonjudgmentalSociety
for Adolescent Health and
Medicine, 2004Slide80
Adolescents Have Rights to ConfidentialityConfidentiality means information told to someone will not be shared with others (e.g., parents, schools, or third-parties)
“It’s private.”Information disclosed to a health care provider is covered by confidentialityTalking with your healthcare provider is considered “private”Information disclosed has limits on how and when it can be disclosed to a third partySlide81
Adolescents Can Consent to a Variety of Treatments
Minor Consent Laws enable minors to consent to some types of health careDepends on the type of careVaries tremendously by state Sensitive health care servicesTreatment and screening for sexually transmitted infections Mental health counselingSubstance use treatment and counseling Reproductive health care Contraceptive careMinor Consent Laws and confidentiality are parts of healthcare privacy
http://
healthpolicy.ucsf.edu/sensitive-health-care-and-electronic-health-records Slide82
Adolescents Are Concerned About Privacy Before Their Visit
Example of Adolescent Concern
What you can do
Before
the visit
Can I make an appointment
myself
to
be
seen?
(Setting up an appointment)
Know about your
state’s confidentiality
and
consent lawsSlide83
Adolescents Are Concerned About PrivacyDuring Their Visit
Example of Adolescent Concern
What you can do
During
the visit
Who else is going to hear what I
say to the healthcare provider?
(Content of the Care)
Reassure adolescent that confidentiality is part of
their care and
important to youSlide84
Adolescents Are Concerned About PrivacyAfter Their Visit
Example of Adolescent Concern
What you can do
After
the visit
Who else is going to see the bill or insurance
claim?
(Claims information)
Know about your state’s
Explanation of Benefits for sensitive services Slide85
Bringing Together the Pieces to Improve Adolescent Health Care
Enhance provider capacity Slide86
Bringing Together the Pieces to Improve Adolescent Health Care
Enhance provider capacity
Incorporate health promotion, disease
prevention, and
youth development Slide87
Bringing Together the Pieces to Improve Adolescent Health Care
Enhance provider capacity
Coordinate services
Incorporate health promotion, disease
prevention, and
youth development Slide88
Bringing Together the Pieces to Improve Adolescent Health Care
Enhance provider capacity
Engage young people
Coordinate services
Incorporate health promotion, disease
prevention, and
youth development Slide89
Bringing Together the Pieces to Improve Adolescent Health Care
Enhance provider capacity
Engage young people
Coordinate services
Assure access
to
vulnerable populations
Incorporate health promotion, disease
prevention, and
youth development Slide90
Bringing Together the Pieces to Improve Adolescent Health Care
Enhance provider capacity
Engage young people
Coordinate services
Assure access
to
vulnerable populations
Assure
consent &
confidentiality
Incorporate health promotion, disease
prevention, and
youth development Slide91
Adolescence: Preparing for Lifelong Health and WellnessSlide92
Parents Can Help AdolescentsPrepare for Lifelong Health and WellnessSlide93
Schools Can Help Adolescents Prepare for Lifelong Health and WellnessSlide94
Healthcare Providers Can Help Adolescents Prepare for Lifelong Health and WellnessSlide95
Communities Can Help Adolescents
Prepare for Lifelong Health and WellnessSlide96
Together We Can Help Adolescents Prepare for Lifelong Health and Wellness