/
Binomial probability distribution, Binomial probability distribution,

Binomial probability distribution, - PowerPoint Presentation

phoebe-click
phoebe-click . @phoebe-click
Follow
423 views
Uploaded On 2016-10-20

Binomial probability distribution, - PPT Presentation

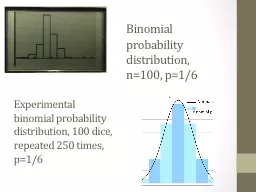
n 100 p16 Experimental b inomial probability distribution 100 dice repeated 250 times p16 Cosine program Pythagorean triples Fermats last theorem Cuius rei demonstrationem ID: 478606

find points height function points find function height baby geogebra curve passing theorem list polynomial days linear graph fermat

Share:

Link:

Embed:

Download Presentation from below link

Download Presentation The PPT/PDF document "Binomial probability distribution," is the property of its rightful owner. Permission is granted to download and print the materials on this web site for personal, non-commercial use only, and to display it on your personal computer provided you do not modify the materials and that you retain all copyright notices contained in the materials. By downloading content from our website, you accept the terms of this agreement.


Presentation Transcript

Slide1

Binomial probability distribution,n=100, p=1/6

Experimental

b

inomial probability distribution, 100 dice,

repeated 250 times, p=1/6Slide2
Slide3

Cosine programSlide4

Pythagorean triplesSlide5

Fermat’s last theorem“

Cuius rei demonstrationem mirabilem sane detexi

, hanc marginis exiguitas non ca- peret.” (“I have discovered a truly marvelous proof of this, which this margin is too narrow to contain.”)Slide6

Some of the mathematicians who worked in the proof of Fermat’s last theoremLeonard Euler

Sophie

GermainSlide7

Andrew WilesSlide8

Homer Simpson proved Fermat Last Theorem is wrong?Slide9

Homer Simpson proved Fermat Last Theorem is wrong?

What is the point of

discussing Fermat’s theoremSlide10

Curve fittingSlide11

Make a graph in

Geogebra of the four points determined by the above data. (Input the points in a spreadsheet first). Use the settings to zoom the graph around the points.Can you determine the height of the baby when she is 25 days old? Can you estimate it?

Can you find a line the line passing through the four points in 1?Can you find a polynomial passing through the four points in 1? Can you find a polynomial of degree 2? What about 3? And 4? What about degree larger than 4?

Can you find a line that passes “close” to the four points in 1.

The height of a baby is measured during her first month of life.When the baby is 1 day old, her height is 20.1 in.When the baby is 15 days old, her height is 20.6 in.When the baby is 20 days old, her height is 21.2 in.When the baby is 29 days old, her height is 21.9 in.

What do I mean by close and closest?Slide12

Define five points in

GeogebraSave the coordinates of these 5 points on a spreadsheet.

Define a linear function and plot it. (Use sliders for the slope and the y-intersect.)Create a vertical segment from one of the points and the graph of the function. Create a tool drawing a vertical segment from a given function to a given point.In the spreadsheet, compute the square of the length of the segments.

Add up all these squared distances.Drag the the parameters of the sliders, trying so the total result is the smallest possible.Can you find (analytically) the values of the sliders that make the sum of the squares of the vertical distances smallest?

Geogebra

Hints:

Curve[3sin(t)*

cos

(t),2tsin(t),t,0,8]Slide13

Find a photo online that contains a curve.

Import the photo in

Geogebra

.

Choose a few points on the curve.

Choose a type of regression (in

Geogebra

you can use linear, polynomial,

exponential among others)

and use it to fit find the equation of a curve “close” to the curve in the picture.

What do we mean by “close”?

Experiment with different pictures and different degrees of polynomials.

Geogebra

Hints:

FitPoly

[list of points, degree

]

FitExp

[]

Fit[ <List of Points>, <List of Functions>

]

FitExp

,

FitLine,

FitLineX,

FitLog,

FitLogistic,

FitPoly,

FitPow and

FitSin.

Polynomial[list of points]Slide14

Is

it possible to find a linear function passing through the points any triple of points in the plane? Why or why not? Is it possible to find a quadratic function passing through through the points

any triple of points on the plane? Why or why not? Given the points, [1,-1/2], [2,1], [2.4,1] and [3,1/3] find a piecewise linear function with domain the interval [1,3] passing through all of them.

Geogebra

Hint:

Function[function, start value, end value]

If[x<-2,x,If[x>3,sin(x),x^3]]