/
Using Image Processing to Track Using Image Processing to Track

Using Image Processing to Track - PowerPoint Presentation

phoebe-click
phoebe-click . @phoebe-click
Follow
371 views
Uploaded On 2016-12-05

Using Image Processing to Track - PPT Presentation

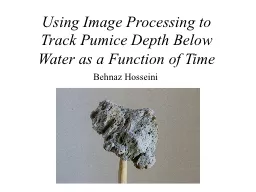
Pumice Depth Below Water as a Function of Time Behnaz Hosseini Havre MESH and Pumice Experiments P umice deposits from 2012 Kermadec Islands submarine eruption north of New Zealand Havre caldera samples collected by MESH team using remotely operated vehicle Jason ID: 497404

images pumice processing image pumice images image processing code toolbox volume total create experiments mesh havre time function track

Share:

Link:

Embed:

Download Presentation from below link

Download Presentation The PPT/PDF document "Using Image Processing to Track" is the property of its rightful owner. Permission is granted to download and print the materials on this web site for personal, non-commercial use only, and to display it on your personal computer provided you do not modify the materials and that you retain all copyright notices contained in the materials. By downloading content from our website, you accept the terms of this agreement.


Presentation Transcript

Slide1

Using Image Processing to Track Pumice Depth Below Water as a Function of Time

Behnaz HosseiniSlide2

Havre, MESH and Pumice Experiments

P

umice deposits from 2012

Kermadec

Islands submarine eruption north of New Zealand

Havre caldera samples collected by MESH team using remotely operated vehicle Jason

Lab experiments conducted to elucidate the processes that allow some pumice to float

and others to sink

Create point cloud and dense

reconstruction

Photogrammetric method to quantify total volume

k

nown total

volume allows

for

porosity calculation:

Φ

= (

ρ

T

R

)/(

ρ

A

R

)Slide3

Go-Pro with time lapse settings (fixed interval of 60 seconds) to acquire series of imagesMATLAB’s image processing toolbox to convert images to binary images and use find function to track

small area on the pumice in a specified columnHypothesis: initial saturation phase (due to capillary suction and hydrostatic pressure in exterior liquid,

Darcy

flow

) and subsequent diffusion

phase

Compare empirical results with theoretical results

More images required to accurately represent progression of pumice submergence

Methods and PurposeSlide4
Slide5

Acknowledgements

Code partly adapted from Kristen Fauria’s (left) code tracking the dimensions of a density current using MATLAB’s image processing toolbox

Dad

(right

) helped write python code to create string of

sequentially

numbered images for seamless loading into MATLAB

loop