/
CADE Reference Data Set NCHA Reference Data CADE Reference Data Set NCHA Reference Data

CADE Reference Data Set NCHA Reference Data - PDF document

piper
piper . @piper
Follow
345 views
Uploaded On 2021-08-16

CADE Reference Data Set NCHA Reference Data - PPT Presentation

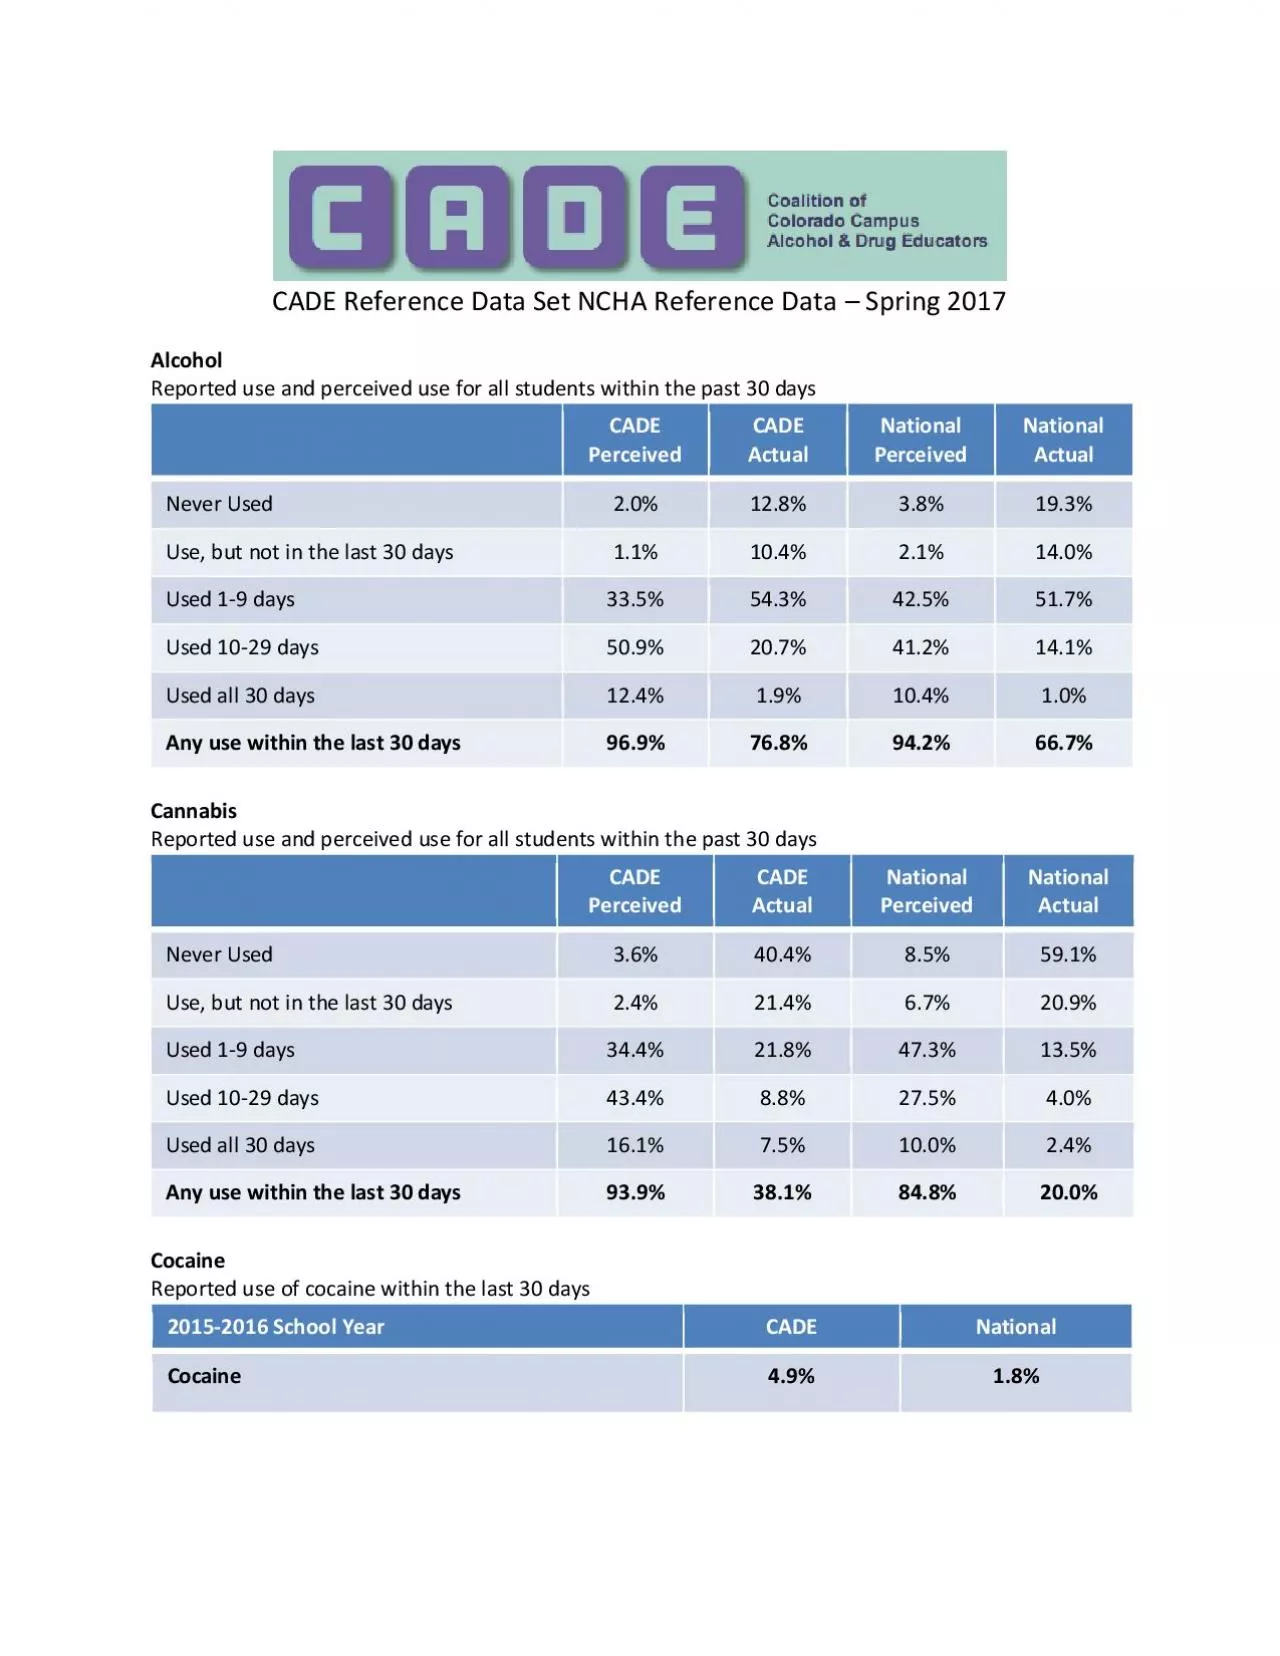
Spring 2017AlcoholReported use and perceived use for all students within the past 30 daysCADE PerceivedCADE ActualNational PerceivedNationalActualNever Used2012838193Use but not in the last 30 days111 ID: 864679

cade days perceived national days cade national perceived ncha reference actual reported group cocaine 2016 2017 data students year

Share:

Link:

Embed:

Download Presentation from below link

Download Pdf The PPT/PDF document "CADE Reference Data Set NCHA Reference D..." is the property of its rightful owner. Permission is granted to download and print the materials on this web site for personal, non-commercial use only, and to display it on your personal computer provided you do not modify the materials and that you retain all copyright notices contained in the materials. By downloading content from our website, you accept the terms of this agreement.


Presentation Transcript

1 CADE Reference Data Set NCHA Reference D
CADE Reference Data Set NCHA Reference Data – Spring 2017 Alcohol Reported use and perceived use for all students within the past 30 days CADE Perceived CADE Actual National Perceived National Actual Never Used 2.0% 12.8% 3.8% 19.3% Use, but not in the last 30 days 1.1% 10.4% 2.1% 14.0% Used 1 - 9 days 33.5% 54.3% 42.5% 51.7% Used 10 - 29 days 50.9% 20.7% 41.2% 14.1% Used all 30 days 12.4% 1.9% 10.4% 1.0% Any use within the last 30 days 96.9% 76.8% 94.2% 66.7% Cannabis Reported use and perceived use for all students within the past 30 days CADE Perceived CADE Actual National Perceived National Actual Never Used 3.6% 40.4% 8.5% 59.1% Use, but not in the last 30 days 2.4% 21.4% 6.7% 20.9% Used 1 - 9 days 34.4% 21.8% 47.3% 13.5% Used 10 - 29 days 43.4% 8.8% 27.5% 4.0% Used all 30 days 16.1% 7.5% 10.0% 2.4% Any use within the last 30 days 93.9% 38.1% 84.8% 20.0% Cocaine Reported use of cocaine within the last 30 days 2015 - 2016 School Year CADE National Cocaine 4.9% 1.8% 2016 - 2017 School Year CADE

2 National Cocaine 7.3% 1.9% Tob
National Cocaine 7.3% 1.9% Tobacco Reported use and perceived cigarette use for all students within the past 30 days CADE Perceived CADE Actual National Perceived National Actual Never Used 7.9% 68.6% 13.1% 76.6% Use, but not in the last 30 days 13.9% 17.4% 15.1% 13.8% Used 1 - 9 days 51.8% 9.3% 46.1% 6.2% Used 10 - 29 days 17.5% 2.2% 14.9% 1.4% Used all 30 days 9% 2.5% 10.8% 2.0% Any use within the last 30 days 78.2% 14% 71.8% 9.6% Prescription Drug Misuse Reported prescription drug misuse within the last 12 months CADE National Antidepressants 2.9% 2.8% Erectile dysfunction drugs 0.8% 0.8% Pain Killers 6.1% 4.6% Sedatives 5.9% 3.8% Stimulants 12.4% 7.2% Used 1 or more of the above 18.5% 12.5% For more NCHA Data, c heck out CADE Collaborate . The CADE offers annual financial support for campuses willing to join the statewide data set. Please contact CADE Project Staff if you are interested. 2016 NCHA Reference Group; 2016 NCHA CADE Reference Group; 2017 NCHA Reference Group; 2017 NCHA CADE Reference Group (http://www.acha - ncha.org