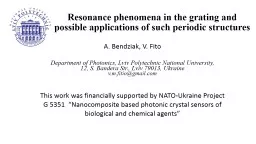
A Bendziak V Fito Department of Photonics Lviv Polytechnic National University 12 S Bandera Str Lviv 79013 Ukraine vmfitiogmailcom This work was financially supported by NATOUkraine Project G 5351 Nanocomposite based photonic crystal sensors of biological and che ID: 801049
Download The PPT/PDF document "Resonance phenomena in the grating and p..." is the property of its rightful owner. Permission is granted to download and print the materials on this web site for personal, non-commercial use only, and to display it on your personal computer provided you do not modify the materials and that you retain all copyright notices contained in the materials. By downloading content from our website, you accept the terms of this agreement.
Slide1
Resonance phenomena in the grating and possible applications of such periodic structures
A. Bendziak, V. FitoDepartment of Photonics, Lviv Polytechnic National University,12, S. Bandera Str., Lviv 79013, Ukrainev.m.fitio@gmail.comThis work was financially supported by NATO-Ukraine Project G 5351 “Nanocomposite based photonic crystal sensors of biological and chemical agents”
Slide2Resonance phenomena in the grating and
possible applications of such periodic structures Volume phase gratingDielectric or metal grating on a metal substrate
Fig. 2. Grating with a rectangular profile, where Λ is the grating period, ε
3
=
ε
m
is the dielectric constant of the metal (gold or silver), ε1=ɛ21 =εa, is the dielectric constant of the investigated medium, ɛ22 is the dielectric constant of the metal or dielectric.
Fig. 1. A sensitive element based on a phase grating with a combined substrate
Slide3Phase grating
Approximately resonance conditions can be written as:
Sensitivity of this structure is described by the following equations:
Sensitivity of the resonant wavelength change due to the change of the investigating solution’s refractive index can be described as
Phase grating
And sensitivity of the resonant angle change is expressed as:
where
We can see, that with increasing incident angle and wavelength,
sensitivity increases.
Phase grating
Fig. 3 shows the
distribution
of the square modulus of the electric field amplitude for the waveguide mode at a wavelength of 740 nm.
Fig. 3. The distribution of the square modulus of the electric field amplitude for the waveguide mode at a wavelength of 740 nm,
d
=1.3 μm, ng
=1.525, thickness of the MgF2
buffer layer 1 μm, n=1.38,
na
=
1.5. Green curve - no buffer layer,
n
s
= 1.515; blue curve - no buffer layer,
ns = 1.45; red curve - substrate made of MgF2 (ns = 1.332); green and blue dots - the buffer layer is present, respectively, with the refractive index of the substrate 1.515 and 1.45.
Slide66
Phase grating
Fig. 4. The amplitude distribution of the field without a buffer layer in the substrate, with refractive index 1.515. Other parameters are the same as in Fig. 3.
Fig.5. Distribution of the field amplitude in the presence of a buffer layer in the substrate with a thickness of 1
μm
. Other parameters are the same as in Fig. 4.
Slide7Phase grating
Fig. 6. The spectral dependence of the reflection coefficient of the grating at the angle of incidence 20o in the presence of the buffer layer with a refractive index of
,
=1.5,
7
Fig.7. The angular dependence of the reflection coefficient of the grating at the wavelength
l=665 nm in the presence of the buffer layer,
= 1.515, = 1.525, d = 1.3
μm.
Phase grating
Table 1 shows the resonant wavelengths for some angles and the sensitivity ,
,
,
for the following waveguide structure parameters:
,
Table 1. Results of calculation of resonant wavelengths and sensitivities for some angles.
8
θ
о
λ
res
,
S
n
,
S
λ
,
S,
1
2
3
4
5
6
10
0.6735791
0.997
–21.16
0.042
6.22
15
0.7072855
1.063
–19.19
0.047
7.10
20
0.7402315
1.127
–17.52
0.053
8.10
250.77211391.189–16.110.0589.23300.80274181.249–14.900.06410.1
θ
о
1
2
3
4
5
6
10
0.6735791
0.997
–21.16
0.042
6.22
15
0.7072855
1.063
–19.19
0.047
7.10
20
0.7402315
1.127
–17.52
0.053
8.10
25
0.7721139
1.189
–16.11
0.058
9.23
30
0.8027418
1.249
–14.90
0.064
10.1
Slide9Phase grating
The following table 2 shows the resonant wavelengths and sensitivities , ,
,
depending on the refractive index
n
a
of the test medium at the incidence angle of the light beam 30o in the presence of the buffer layer. If there is no buffer layer, the data is given in the denominator of the cells in the table. Other parameters are: ,
Table 2. Results of calculation of resonant wavelengths and sensitivities for some refractive indices of the investigated medium.
λ
res
,
S
n
,
S
λ
, S,
O
1
2
3
4
5
6
1
0.7998599/0.804098
0.0169/0.0157
–15.10/–14.791
0.00084/0.00080
0.136/0.13
1.332
0.8004501/0.804253
0.0769/0.0186
–15.06/–14.798
0.00385/0.00095
0.619/0.16
1.35
0.8005246/0.804273
0.0884/0.0216
–15.05/–14.798
0.0044/0.0011
0.710/0.18
1.4
0.8008052/0.8043510.1423/0.0361–15.03/–14.7950.0071/0.00181.147/0.311.450.8013104/0.8044960.288/0.0778–14.99/–14.7910.0145/0.003962.325/0.661.5
0.8027418/0.804951
1.249/0.3973
–14.90/–14.7750.0639/0.020210.09/3.37
12345610.7998599/0.8040980.0169/0.0157–15.10/–14.7910.00084/0.000800.136/0.131.3320.8004501/0.8042530.0769/0.0186–15.06/–14.7980.00385/0.000950.619/0.161.350.8005246/0.8042730.0884/0.0216–15.05/–14.7980.0044/0.00110.710/0.181.40.8008052/0.8043510.1423/0.0361–15.03/–14.7950.0071/0.00181.147/0.311.450.8013104/0.8044960.288/0.0778–14.99/–14.7910.0145/0.003962.325/0.661.50.8027418/0.8049511.249/0.3973–14.90/–14.7750.0639/0.020210.09/3.37
Slide10Phase grating
Table 3 shows the resonance angles
for the wavelength of the test laser 665 nm for different refractive indices of the test medium in the presence of the buffer layer with the refractive index of 1.38,
,
Table 3. Results of calculation of resonant incidence angles and angular sensitivities for some refractive indices of the studied environment
.
S
n
,
,
1
2
3
4
1
9.014702
0.0128
0.0788
1.332
8.599422
0.0590
0.360
1.35
8.952432
0.0679
0.417
1.4
8.926031
0.1100
0.681
1.45
8.878374
0.2234
1.37
1.5
8.7
39596
0.9801
6.01
1
23419.0147020.01280.0788
1.332
8.599422
0.05900.360
1.358.9524320.06790.4171.48.9260310.11000.6811.458.8783740.22341.371.58.7395960.98016.01
Slide11Phase
grating 11
As we can see from Table 3, the angular sensitivities increase with the increase of the refractive index of the test medium. Moreover, a particularly sharp increase is observed when the refractive index of the test medium approaches the grating refractive index.
The half-width of the spectral curve is
nm. From Table 1 follows that the sensitivity S = 53 nm at the incidence angle of the beam 20
o
for the refractive index of the test medium 1.5. If the refractive index change is 0.0001, then the change in the resonance wavelength will be 0.0053 nm, which is about 1.8 times the spectral width of the resonance curve. At a wavelength of 665 nm, the angular sensitivity (see Table 3) to the change in the active medium is 6.01
. If the refractive index of the active medium changes by 0.0001, then the resonance angle will change by 0.0006, which corresponds to 2.16 arcseconds, which is about 7 times the angular width of the resonance curve. That is, theoretical analysis shows that the sensor based on the phase grating can sense a change in the refractive index of the study environment 0.0001.
Slide12Dielectric or metal grating on the metal substrate
With resonant excitation of a surface plasmon-polariton wave with normal incidence of a plane wave, the following conditions must be satisfied. At resonance the reflection coefficient is zero.12
,
Based on this relationship, it is possible to calculate the sensitivity of the resonant wavelength to a change in the refractive index of the test material
Dielectric or metal grating on the metal substrate
13Resonance absorption of the electromagnetic wave energy is observed at carefully selected parameters of the grating and wavelength. The grating parameters and the resonant wavelengths are given in Table 4 for a silver substrate. Table
4
.
Parameters
of periodic structures with silver
substrate and resonances wave lengths defined by the RCWA and FEM
№
d
res, nm
ɛ
1
ɛ
22
F
λres, µm, (RCWA)λres, µm, (FEM)Δλ, nm1234
5
6
7
1
25
1
Ag
0.857
1.0184
1.0181
1.1
2
50
1
Ag
0.143
1.0035
1.0039
0.6
3
13.4
1
Ag
0.5
1.0109
1.0107
0.8450190.8571.14691.1450
6
5
551
90.1431.02511.02442.36129.1120.51.0731.07222.5
Slide14Dielectric or metal grating on the metal substrate
14Comparison of columns 5 and 6 shows a good fitting of the resonant wavelengths determined by two methods. The angle of incidence of the optical wave on the grating is normal in all calculations. The grating period is 1 μm for all examples.
Figure 2 shows the spectral dependence of the reflection coefficient for the structure number 3. The width of the resonance curve is equal to 0.8 nm, that is, the Q-factor is equal to Q =
λres
/
Δλ
=1264. Therefore, such structures can be used as sensitive sensor elements.Fig.8,
Spectral dependence of the reflection. Dots are calculated
by RCWA
and the
continuous curve
is
described
by
the Lorentz function.
Slide15Dielectric or metal grating on the metal substrate
The distribution of the electric field above the grating for the periodic structure No.3 is shown in Fig. 9. It can be seen that the strongest field is concentrated in a rather small volume. Fig. 10 shows the distribution of the magnetic field above the grating. It should be noted that the strongest field occupying a significant volume above the grating.15
Fig. 9.
Distribution
of
the electric field above the grating near
the right
angle in
the metal
at
the
resonant wavelength of 1010.7 nm for the periodic structure
No
. 3.
Fig.10.
The
distribution
of
the
magnetic
field
in
the
grating
at
a
resonant
wavelength of 1010.7 nm for the periodic structure No. 3.
Slide16Dielectric or metal grating on the metal substrate
It is known that gold is more resistant to external influences, and its characteristics from the point of view of the resonance of
plasmon-polariton
waves are slightly worse than silver. Table 5 shows the parameters of the SPP resonance for the gold substrate. The angle of incidence of the optical wave on the grating is normal in all calculations. In addition, the width of the resonances for the gold substrate is greater than for the silver substrate. This is due to the fact that the imaginary part of gold dielectric permittivity is higher than the imaginary part of the silver permittivity.
Table
5. P
arameters of periodic structures with gold substrate and resonances wave defined by the RCWA and FEM.16Ʌ, nm
dres, nm
ɛ1
ɛ22
F
λ
res
, µm, (RCWA)
λ
res, µm, (FEM)Δλ, nm123
4
5
6
7
8
1000
14.81
1
Au
0.5
1.0124
1.0125
1.3
1000
55
1
9
0.16
1.03417
1.03421
2.6
750
55.3
1.777
9
0.2
1.0519
1.0519
6.1
Slide17Dielectric or metal grating on the metal substrate
The distribution of the electric field in the periodic structure at the resonant wavelength is shown in Fig. 11. It can be seen that the strongest field is concentrated in a fairly small volume. Therefore, the strong field will come in contact with the test substance in a small volume. However the magnetic field takes up a significant volume above the grating and will strongly interact with the test substance. Fig. 12 shows the distribution of the magnetic field in the grating on gold substrate. The enhanced field occupies a considerable volume above the grating.
Fig. 11.
Distribution
of
the
electric field above the grating near the right angle
in the metal
at the
resonant wavelength
of
1012.5
nm
for
the periodic structure No 1.Fig.12. The distribution
of
the
magnetic
field
in
the
grating
at
a
resonant
wavelength
of
1012.5
nm
for
the periodic structure No 1.17
Slide18Dielectric or metal grating on the metal substrate
Fig. 13 shows the change in the wavelength of the resonance for the structure No 2 (Fig. 13a) and No 3 (Fig. 13b) from Table 5. It can be concluded from Fig. 13 that there is the strong linear dependence of the change in the resonant wavelength on the change in the refractive index. The sensitivity for structure № 2 will be 910 nm (gas), and for structure №3 (water solutions) the sensitivity is equal to 670 nm. The change in the resonant wavelength is proportional to the change in the refractive index of the medium.
Fig. 13 Dependences of the change in the resonance wavelength on the refractive index of medium which contacts with the dielectric grating on the metal substrate for gas media (a) and aqueous solutions (b).
Slide19Dielectric or metal grating on the metal substrate
19Thus, it is appropriate to use such a structure (Fig. 10) to study luminescence excited by magnetic-dipole interaction. The strong magnetic field is concentrated in the dielectric for the dielectric grating (No. 2 and 3 of Tabl. 5) on the gold substrate and this field will not contact with test the substance. However, there is a strong electric field in these structures, which occupies a large volume above the grating.
It is obviously that such structures under
plasmon-polariton
resonance are expediently used for Raman spectroscopy and to the study of luminescence excited during electrically dipole interaction. Structure No. 3 can be used to study the aqueous solutions of active substances, because the wavelength of the resonance is determined by the refractive index of the solution.
Slide2020
Thank you for your attention!