PDF-HOGU CHARTS GEN1
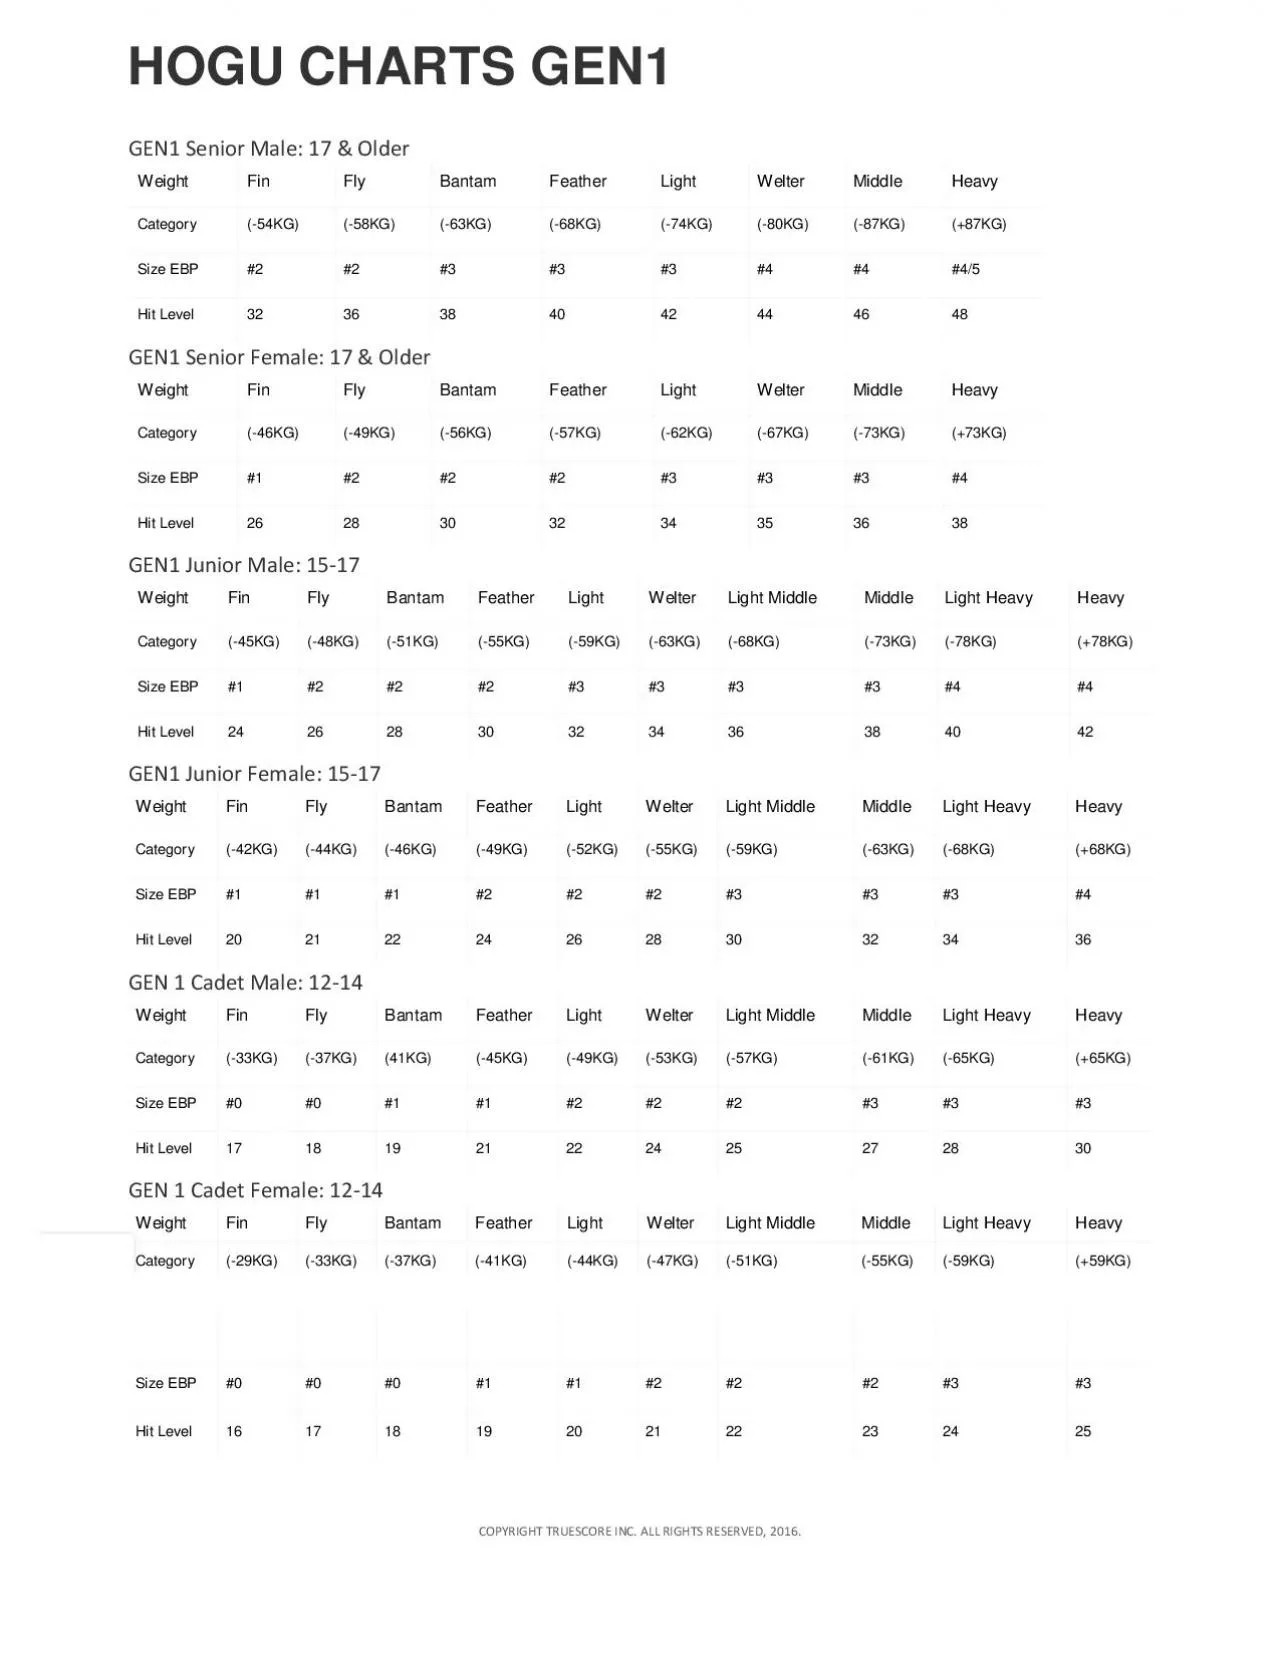
GEN1 Senior Male 17 OlderWeightFinFlyBantamFeatherLightWelterMiddleHeavyCategory54KG58KG63KG68KG74KG80KG87KG87KGSize EBP223334445Hit Level3236384042444648GEN1 Senior
Download Presentation
"HOGU CHARTS GEN1" is the property of its rightful owner. Permission is granted to download and print materials on this website for personal, non-commercial use only, provided you retain all copyright notices. By downloading content from our website, you accept the terms of this agreement.
Presentation Transcript
Transcript not available.