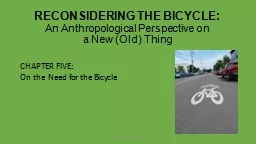
June 4 2019 Binny Paul Background BICYCLE TRANSPORTATION No more only a recreational mode Now a utilitarian alternative for short to medium distance trips Access and egress connection for public transport ID: 800930
Download The PPT/PDF document "Modeling Bicycle Route Choice in Travel ..." is the property of its rightful owner. Permission is granted to download and print the materials on this web site for personal, non-commercial use only, and to display it on your personal computer provided you do not modify the materials and that you retain all copyright notices contained in the materials. By downloading content from our website, you accept the terms of this agreement.
Slide1
Modeling Bicycle Route Choice in Travel Models
June 4, 2019
Binny Paul
Slide2Background
BICYCLE TRANSPORTATION
No more only a recreational mode
Now a utilitarian alternative for short to medium distance trips
Access and egress connection for public transport
Significant impact on air quality, energy use and public health
Receiving more policy interest and funding support
CHALLENGES IN TRAVEL MODELS
Simulate bicycle travel more realistically
Include sensitivities necessary for planning
Assess benefits of investments in bicycle infrastructure
Slide3Bike Route Choice Model
The parameters on distance traveled on different types of bicycle facilities were assembled from results from various bike route choice models (Portland Oregon, San Francisco, and Monterey Bay Association of Governments).
Variable
coefficient (Miles)
“Minutes” PER MILE
Arterial with no bike lanes
-1.05
6
Arterial with class I bike lanes
-0.348
2.0
Arterial with class II bike lanes
-0.544
3.1
Arterial with class III bike lanes
-0.858
4.9
Cycle Tracks
-0.424
2.4
Arterial without bike lane wrong-way
-3.445
19.7
Freeway
-9999
999
Slide4Trip-based vs. ABM Implementation
MAG Trip-based Model
~3K TAZs
Planning Network
Bike Access for Transit
Fresno COG ABM
~22 K MAZs (Census Blocks)
All Streets Network
Bicycle PATH TYPE
MAG
Fresno COG
Multi-Use Path – Paved
2.0
2.0
Multi-Use Path – Unpaved
5.5
-
Bike Lane
3.13.1Bike Route4.94.9Paved Shoulder5.5-None66
Bicycle Generalized Cost Parameters (“Minutes” Per Mile)
vs.
Slide5MAG Trip-Based: Bike Assignment
Slide6Strava
Bicycle Map for Phoenix
Slide7MAG TBM – Non Motorized Transit Accessibility
Walk
Bike
PM period, accessibility from a downtown zone via Urban Rail (with a possible Bus Transfer)
Slide8Fresno ABM – Bike Skims at Different Geography
maz_gencost
– MAZ to MAZ using generalize cost function
maz_dist – MAZ to MAZ using shortest distance
zone_dist
– TAZ to TAZ using shortest distance
Zone_DIST
Maz_dist
MAZ_GenCost
2.05
1.96
2.08
Avg. Trip Length
(Miles)
Slide9Fresno ABM – Bike Assignment
Slide10Conclusions
A higher resolution network + micro-zone level land use results in a more realistic representation of bicycle travel
Detailed representation of bicycle infrastructure can improve sensitivity
Addition of bike-access to transit allows more realistic representation of transit path choice
The models show appropriate sensitivity to change in bike facility parameters
Travel models represent mainly utilitarian bicycle trips.
Strava
data consists mostly of recreational bike trips
Would benefit from more bike count data for validation
Models can be used for policy design and bike infrastructure planning
Slide11BINNY PAUL
CONSULTANT
Binny.Mathewpaul@rsginc.com
NAGENDRA DHAKAR
CONSULTANT
Nagendra.Dhakar@rsginc.com