/
Hurricane Jose Debrief October Hurricane Jose Debrief October

Hurricane Jose Debrief October - PowerPoint Presentation

robaut
robaut . @robaut
Follow
352 views
Uploaded On 2020-08-03

Hurricane Jose Debrief October - PPT Presentation

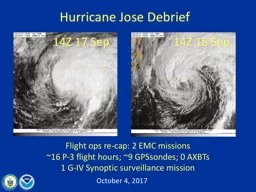
4 2017 Flight ops recap 2 EMC missions 16 P3 flight hours 9 GPSsondes 0 AXBTs 1 GIV Synoptic surveillance mission 14Z 17 Sep 14Z 1 8 Sep Agenda Missions Overview ID: 795940

jose tdr shear utc tdr jose utc shear al12 20170918h1 flight mission left dwl sep radar downshear missions data

Share:

Link:

Embed:

Download Presentation from below link

Download The PPT/PDF document "Hurricane Jose Debrief October" is the property of its rightful owner. Permission is granted to download and print the materials on this web site for personal, non-commercial use only, and to display it on your personal computer provided you do not modify the materials and that you retain all copyright notices contained in the materials. By downloading content from our website, you accept the terms of this agreement.


Presentation Transcript

Slide1

Hurricane Jose Debrief

October

4

, 2017

Flight ops re-cap: 2 EMC missions~16 P-3 flight hours; ~9 GPSsondes; 0 AXBTs1 G-IV Synoptic surveillance mission

14Z 17 Sep

14Z 18 Sep

Slide2

Agenda

Missions

Overview (Reasor

)Science Discussions170917H1 TDR (J. Zhang)

170918H1 TDR (Zawislak)

Slide3

Missions Overview

Purpose

: EMC-tasked TDR data collection targeting 00 UTC and 12 UTC HWRF cycles

Target: H Jose on 17-18 Sep as it moved northward to the east of the Carolinas

Background: At one point Jose had been a MH, but then weakened to a TS as it executed a clockwise loop. Jose re-intensified to a H prior to the missions.Mission highlights: Sampled hurricane w/ *potential* for NE U.S. impact; transmitted recon data for HWRF DA (00Z & 12Z). Tested DWL for first time during 2017 season.

Slide4

Missions Overview (local times)

17 Sep

: 4PM mission18

Sep: 4AM mission

Slide5

20170917H1 JOSE

(TDR mission)

LPS+DWL: Jun Zhang Radar: Robert BlackDropsonde: flight director Ground Radar: Paul Reasor80 kt

MOTION (8 kt)SHIPS SHEAR (~40 kt)

Strong south-westerly shear

Slide6

Flight track

Takeoff: 1955 UTC

Rotated Fig. 4, 10 kft, 90 nmDropsondes only at the first passNo AXBT3 Dropsondes (2 HFIP, 1 NHC)

Slide7

Slide8

Slide9

SOUTH (USR)

NORTH (DSL)

WEST (USL)EAST (DSR)The downward vertical motion may be strongest on the downshear-right side where the rainfall is weakest.

Slide10

NE (DOWNSHEAR)

SW (UPSHEAR)

SE (RIGHT, SHEAR)NW (LEFT, SHEAR)The downward vertical motion may be strongest on the downshear side.The rainfall is largest left of the shear.

The storm center shifted to the east; possible new center forming near the bursts on the down-shear side.

Slide11

Largest precipitation is located at downshear-left to left of the shear direction.

Vortex tilt seems to be relatively small in such a strong-shear environment.

shear

Slide12

Some Caveats

TDR analysis encountered problem for the first 2/3 of the mission (disk space, software, turbulence, etc.). Problem was solved in the end and TDR analyses were sent to EMC on time.

DWL scanner could not be initiated due to commination (VNC) problem. DWL scanning at a fixed angle. Data were collected throughout the mission. Working with Dave Emmitt after the flight for 1-2 hours at midnight. Deep convection (or convective bursts) was avoided on the NE leg. This type of problem was fixed after communicating with flight director. It was a bumpy flight with seat-belt light on for ~ 2-3 hours. 20170917H1 JOSE

(TDR mission)

Slide13

20170918H1 AL12 JOSE (TDR)

LPS: Zawislak

Radar: ZawislakDropsonde: Zawislak / RyanDWL: RyanGround Radar: GamacheTakeoff: 0750 UTC, Landing: 1602 UTCRotated Fig. 4, 8 kft, 90 nmDropsondes at turn points of first Fig. 4; each center pass, if NHC requestedSonde halfway transit to storm at ferry altitude

972 mb / 80 kt

MOTION (8 kt)SHIPS SHEAR (37 kt)0950 UTC (Arrival at IP)

Slide14

20170918H1 AL12 JOSE (TDR)

Slide15

20170918H1 AL12 JOSE

(TDR)

Truncation due to airspace

Slide16

20170918H1 AL12 JOSE (TDR)

1017 UTC

1030 UTC1122 UTC

1115 UTC

Slide17

1222 UTC

1215 UTC

1327 UTC

1330 UTC20170918H1 AL12 JOSE (TDR)

Slide18

20170918H1 AL12 JOSE (TDR)

SOUTH (USR)

NORTH (DSL)WEST (USL)EAST (DSR)

Slide19

20170918H1 AL12 JOSE (TDR)

NE (DOWNSHEAR)

SW (UPSHEAR)SE (RIGHT, SHEAR)NW (LEFT, SHEAR)

Slide20

20170918H1 AL12 JOSE (TDR)

Slide21

20170918H1 AL12 JOSE

(TDR)

Slide22

Summary

Problems

Expendables:T/O: 972 mb / 80 kt L/D: 977 mb / 65 ktSlow weakening (peak SFMR

sfc. wind 58 kt, FL 70 kt)Highest winds 80-100 nm from centerCenter Passes: 1017 UTC, 1122 UTC, 1220, and 1330 UTC

4 TDR analyses (truncation, noise due to lack of precipitation)Dropsonde on transit to IP at 21 kft, at turn points of 1st Fig. 4, last center (NHC)A lot of noise introduced into analyses due to lack of radar returns in eastern, southern regions of the stormDWL stuck in a fixed scan, but appeared to collect data throughout the missionDifficulty operating DWL from station 26 Dropsondes (5 HFIP, 1 NHC)20170918H1 AL12 JOSE (TDR)