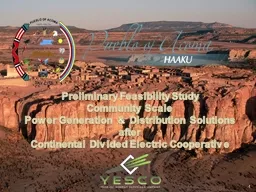
/
New Directions:  Outline of Acoma’s Energy Future After Continental Divide Electric New Directions:  Outline of Acoma’s Energy Future After Continental Divide Electric

New Directions: Outline of Acoma’s Energy Future After Continental Divide Electric - PowerPoint Presentation

rouperli
rouperli . @rouperli
Follow
343 views
Uploaded On 2020-09-29

New Directions: Outline of Acoma’s Energy Future After Continental Divide Electric - PPT Presentation

Presentation to Acoma Pueblo by Working Session Draft 10272016 1 Glossary Peak Demand the maximum energy required at a specific time expressed in thousands of watts kilowatts or KW KWmo ID: 812440

session kwh 2016 draft kwh session draft 2016 working power load amp gas mwh natural energy acoma generator loads

Share:

Link:

Embed:

Download Presentation from below link

Download The PPT/PDF document "New Directions: Outline of Acoma’s En..." is the property of its rightful owner. Permission is granted to download and print the materials on this web site for personal, non-commercial use only, and to display it on your personal computer provided you do not modify the materials and that you retain all copyright notices contained in the materials. By downloading content from our website, you accept the terms of this agreement.


Presentation Transcript

Slide1

New Directions: Outline of Acoma’s Energy Future After Continental Divide Electric Coop

Presentation to Acoma Pueblo by

Working Session Draft

10/27/2016

1

Slide2

GlossaryPeak Demand: the maximum energy required at a specific time, expressed in thousands of watts (kilowatts or KW)$KW-mo

: the $/KW price x the maximum of KW recorded at the electric meter over the past 12 months kWh: thousands of watts/hour of energy produced or used over time$/kWh

: the price per kWh consumed or producedBtu (British thermal unit): measure of energy required to raise 16 oz. of water by one degree F. $/

MMBtu: price per 1 million btu, the standard price increment for natural gas.

Standard Cubic Foot (SCF): for Natural Gas, 1 scf typically = 950-1,150

btu

. 1

mmbtu = 1,000 scf of natural gasLoad Factor: for an electric generator: Full load = running the generator 100% of the timePartial Load = running the generator as less than 100% of the timeAvailability: the percent of time an electric generator or source of electric supply is available to produce or supply electricity. Capacity: the maximum amount of power in KW that can be produced by a generatorCapacity Factor: the average amount of capacity produced by a generator over timeOutage: forced (ie, a breakdown) or scheduled (down time for maintenance)Heat Rate: the btu required to produce a kWh of electricityReliability: the measure of certainty in receiving power from a given source. Reliability has to take into account outages (forced and scheduled)N-1 Reliability Risk: the risk of loss to the electric supply system from the single largest potential failure event on the system. This can include the forced outage or failure of:the transmission line or substation feeding the system for any scenario involving delivery of wholesale power, or the largest generating unit under a self-supply scenario.

Working Session Draft

10/27/2016

2

Slide3

BackgroundAcoma and CDEC have agreed to “part ways”Enables Acoma to either:Grant another utility a “franchise” and become their retail customer (a “new” CDEC), or

Maintain Independence by forming a Tribal Utility Authority (TUA) Transition Period:Power Purchase Agreement Self-Generate Power

CDEC may be available during the transition to:Provide Acoma TUA with power requirementsHelp operate and maintain Acoma’s distribution system

Working Session Draft

10/27/2016

3

Slide4

Results Summary100% Wholesale Power (including WAPA allocation) is most expensive option at $0.0843/kWh ($84.30/MWH, Navopache/PNM PSA, 2013)

The regional market for purchased power is +/- $0.07/kWh ($70/MWH) – electrical transmission and substation costs are major considerationsEngine/generators w/natural gas fuel at $3.96/

mmbtu and 80% load factor are priced at $0.082/kWh ($82/MWH) and is the most cost-effective and reliable solution, with the potential for improved economics via Combined Heat & Power, priced at about $0.076/kWh ($76/MWH)

Working Session Draft

10/27/2016

4

Slide5

Energy Options: Tribal Utility AuthorityMeeting Power & Energy Requirements:WAPA Capacity & Energy Allocation

Purchase Wholesale Power off the GridSelf-Generate some or all of Acoma’s needs“Behind the Meter” for specific loadsCentral/Distributed Plant to meet all or most loads

Acoma Electricity Distribution System: Third Party Vendor/ContractLong-term arrangement Short term, with transition to Acoma operations

Working Session Draft

10/27/2016

5

Slide6

Current Loads, 2011 per CAR* Study of Acoma for CDEC, July 2012

Energy: 22 MM kWh/yearAssumed Capacity Factor: 60%Imputed KW Demand (Peak Load): 22 MM kWh/yr / 8,760 hrs/yr / 60% capacity factor = 4,318 KW

* Center for Advanced Research

Working Session Draft

10/27/2016

6

Slide7

Acoma data for 2011 by Category, per Center for Advanced Research* July 2012

2011

TotalResidential

Small Commercial (<50 KW/mo)

Large Commercial & Industrial (>50 KW/mo)

Meters

937

8091262Sales/yr$1.75 MM$636k$639K$482k Pct of Total36%36%28%Energy (kWh)/yr22.7 MM5.6 MM

7.3 MM9.8 MM

Pct of Total

25%

32%

43%

Effective $/kWh

$0.077

$0.1129

$0.0868

$0.0491

* Numbers not verified by YESCO

Working Session Draft

10/27/2016

7

Slide8

Average Measured ABE Loads & Costs, Mar 2010 – Feb 2011 Data

Accts >50 KW

except other commerclPublic Fire & Safety

Tribal Admin *

Cultural CenterCasino Signage

Casino&

Hotel

Travel CenterCasino Hiway SignOther Commercial <50 KW (24 meters)Ave Mo $$2,803$789$3,828$1,914$29,894$7,164$2,796$7,569Ave KW-mo

75

29113

48

660

160

74

na

$KW-mo

$561

$216

$846

$600

$4,463

$1,196

$1,108

na

kWh-mo

30,360

6,059

38,840

19,820

369,933

87,880

27,956

77,083

Effective

$/kWh

$0.0923

$0.1302

$0.0986$0.0966$0.0808$0.0815$0.100$0.0982KW - Peak89541515782818374naAve KW as % of Peak KW72%28%53%68%61%78%99%na* Exceeded 50KW in only 1 of 12 months

Working Session Draft

10/27/2016

8

Slide9

Wholesale Power Sources: Existing Allocation from WAPA to AcomaDemand ($5.18/KW-mo):

Summer (Apr – Sep): 410 KW/moWinter (Oct – Mar): 420 KW/moEnergy ($0.0122/kWh): Summer: 783,229/kWh total;

ave = 130,538/kWh/moWinter: 750,759/kWh total; ave = 125,127/kWh/mo

Transmission Delivery Costs: $1.14/KW-mo + $0.0162/kWhAll-in delivered cost = $0.0489/kWh ($48.90/MWH)

(Note: The WAPA allocation is equivalent to about ½ the power used by the hotel casino, at about 60% of CDEC’s cost)

Working Session Draft

10/27/2016

9

Slide10

Wholesale Power: 5,000 KW estimated Peak Requirement (assumes 100% of Acoma supply)

Customer/Whsle SupplierDemand:

$/KW-moEnergy:$/kWh

Effective Rate:$/kWh

Gallup/PNM (expired 2013)$15.75

$0.0243

$0.0603

Navopache/PNM: 2012 PSA$20.49$0.00961+ $0.024 fuel = $0.0336$0.0843Regional Market: (Gallup bids, JAN)+/-$0.07/kWhPotential for PNM off-peak power (8pm-8am) for use in partial self-supply options – no discussions have taken place<$0.04/kWhWorking Session Draft

10/27/2016

10

Slide11

Acoma Rate Forecast: WAPA + PNM (Novapache PSA, 2013): 5,000 KW peak requirement

KW-mo

$/KW-mo

$/KW/yr

kWh/yr$/kWh/yr

Total

Cost/yr

Effective Rate$/kWhWAPA KW+kWh415 (ave)$5.18$25,7961.5 MM$0.0122$18,699$44,496$0.0290WAPA Trans415 $1.14

$5,677

1.5 MM$0.0162

$24,805

$30,482

$0.0199

PNM

KW+kWh

4,585

$20.49

$1.127 MM

21.6 MM

$0.0336

$0.711 MM

$1.839 MM

$0.0869

Total Costs

$1.16 MM

$0.755 MM

$1.913 MM

$0.0843

Distribution

System O&M per T or C , plus $50k/yr Reserve Fund

$295k

$0.0130

Total/Yr

5,000

$1.16 MM

22.7 MM

$0.755 MM

$2.209MM$0.0973Working Session Draft10/27/201611

Slide12

Self GenerationIndividual loads (behind the meter)Combined loads (casino/hotel, travel center, signage, lighting)Full loads: grid independence

Merchant PowerPeakingIntermediateBaseload

RenewablesWorking Session Draft

10/27/2016

12

Slide13

Self GenerationSupply full or partial load requirements Gas-fired micro turbine/generator (GT) or internal combustion engine/generator (ICE)Optional heat recovery of process heat for space heating/cooling, hot water, low level (ICE) or high level (GT) steam

Small scale: estimated 4,300 KW peak load in 2011, growing to 10,000 KW with Industrial ParkPrime Considerations: Reliability

PriceIncremental Expansion Capability

Working Session Draft

10/27/2016

13

Slide14

Technology OptionsGas Turbines: Higher capital & operating costs; not efficient under partial load, not scalable, reduced reliability (too large to fail)

Internal Combustion Engine (ICE)/Generators:Efficient in full or variable load conditionsSmall size options (400, 800, 1500, 2000 KW) allow multiple machines to be optimally matched with variable loads (scalable and redundant)

4,800 KW of ICE units = $7.96 million installed cost ($1,650/KW)Highest reliability for AcomaService contracts readily available

Working Session Draft

10/27/2016

14

Slide15

Caterpillar CG132-6 800 KW Engine/GeneratorOutput: 800 KWHeat Rate (LHV):100% load = 9,049

btu/kWh75% load = 9,376 btu/kWh50% load = 10,068/

btu/kWh41.5% electrical efficiency = highest in the industry

Working Session Draft

10/27/2016

15

Slide16

Self-Generation Model Inputs and ResultsInputs:4,800 KW gross generating capacity (no spare engine)

$7.96 million installed costNatural Gas at $3.96/mmbtu (Dec 2013 quote – NG is a pass through item tied to index)Average 80% Capacity Factor

Debt: 20 year period; 3.12% per annum rateOperating & Maintenance Costs (Variable and Fixed) per Cat specifications2% annual escalation (wholesale power purchases presumed to escalate at the same rate)

Results: $0.0822/kWh ($82.22/MWH) in Yr 1

Working Session Draft

10/27/2016

16

Slide17

Natural Gas Price Forecast, March 2012

Working Session Draft

10/27/2016

17

Slide18

Natural Gas Price Forecast, April 2011

Working Session Draft

10/27/2016

18

Slide19

Natural Gas Short-Term Outlook, February, 2014

Working Session Draft

10/27/2016

19

Slide20

Natural Gas Liquids Spot Prices (Propane), 2013 - 2014

Working Session Draft

10/27/2016

20

Slide21

Results Summary100% Wholesale Power (including WAPA allocation) is most expensive option at $0.0843/kWh ($84.30/MWH, Navopache/PNM PSA, 2013)

The regional market for purchased power is +/- $0.07/kWh ($70/MWH) – electrical transmission and substation costs are major considerationsEngine/generators w/natural gas fuel at $3.96/

mmbtu and 80% load factor are priced at $0.082/kWh ($82/MWH) and is the most cost-effective and reliable solution, with the potential for improved economics via Combined Heat & Power, priced at about $0.076/kWh ($76/MWH)

Working Session Draft

10/27/2016

21

Slide22

Financing OptionsUSDA Rural Utility Systems (RUS): Targets Indian Country InfrastructureInterest Rates as low as 2%

New Market Tax Credits (NMTC):“leveraged” NMTC strips 39% out as federal tax creditDiscounted value paid by investor (about 30% of total loan value) for tax credit, which is not repaid

Potential for tribal sharing in tax credit payment7 year debt repayment w/rollover to longer termTribal Economic Development (TED) Bonds

US Treasury Dept programTax free bond issueThird Party Conventional Financing

Working Session Draft

10/27/2016

22

Slide23

Way ForwardAcquire 15 minute meter data from CDECDevelop plan and schedule for establishing Tribal Utility Authority (electricity & gas)Clearly define costs of distribution system

Determine additional power needs of Industrial Park and new tribal loadsIdentify CHP opportunitiesEvaluate/optimize engine/generator loads by location

Working Session Draft

10/27/2016

23

Slide24

Thank You

Working Session Draft

10/27/2016

24