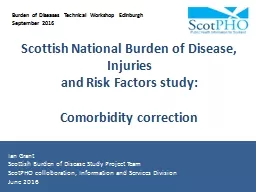
/
Scottish National Burden of Disease, Injuries Scottish National Burden of Disease, Injuries

Scottish National Burden of Disease, Injuries - PowerPoint Presentation

ruby
ruby . @ruby
Follow
343 views
Uploaded On 2022-05-14

Scottish National Burden of Disease, Injuries - PPT Presentation

and Risk Factors study Comorbidity correction Ian Grant Scottish Burden of Disease Study Project Team ScotPHO colloboration Information and Services Division June 2016 Burden of Diseases Technical Workshop Edinburgh September 2016 ID: 911121

disease comorbidity age simulation comorbidity disease simulation age number population health conditions sbod probability morbidities gbd yld diseases disability

Share:

Link:

Embed:

Download Presentation from below link

Download Presentation The PPT/PDF document "Scottish National Burden of Disease, Inj..." is the property of its rightful owner. Permission is granted to download and print the materials on this web site for personal, non-commercial use only, and to display it on your personal computer provided you do not modify the materials and that you retain all copyright notices contained in the materials. By downloading content from our website, you accept the terms of this agreement.


Presentation Transcript

Slide1

Scottish National Burden of Disease, Injuries

and Risk Factors study:

Comorbidity

correction

Ian Grant

Scottish Burden of Disease Study Project Team

ScotPHO colloboration, Information and Services DivisionJune 2016

Burden of Diseases Technical Workshop Edinburgh September 2016

Slide2

GBD’s focus on correcting the estimates of cause-specific YLDs and total YLD for the

biasing influence of comorbidity, rather than on analysing patterns of comorbidity per se.

Models comorbidity in a large micro-simulated population and uses this to adjust disability weights in the final estimates - wherever possible, inputs to the micro-simulation for each country

, age, sex, year group will be at the level of health sequelae -

places no upper limit on the number of comorbid conditions - micro-simulation process

repeated (for each country-age-sex- year) 1000 times2Comorbidity in GBD

Slide3

Comorbidity

in GBD

Model comorbidity assuming independent multiplicative model (i.e. probability of experiencing a combination of

sequelae is simply the product of the probabilities of experiencing each of the constituent sequelae).

Independent vs. Dependent comorbidity (i.e. diseases may ‘cluster’ because of common risk factors, or because one disease is itself a risk factor for other diseases. GBD tested independence assumption using US Medical Expenditure Panel Survey data which suggest that error in the magnitude of YLDs from using the independence assumption is minimal

(Murray et al 2012)In New Zealand, reductions in overall YLD for dependent comorbidity beyond that required for adjustment due to independent comorbidity were small, although they did increase slightly with age (New Zealand Ministry of Health 2012)3

Slide4

4

SBoD comorbidity process

Broadly following the GBD’s methodological framework when adjusting our baseline (or default) estimates of YLDs for

comorbidity bias

i.e. Applying the multiplicative independence model : to Scottish estimates of individual disease and injury

prevalences, to estimate prevalences for comorbidity, to the GBD disability weights / health losses for individual diseases and injuries, to estimate weights for comorbidity.


Slide5

SBoD comorbidity simulation

algorithm

Work with a synthetic population of size n, with the same age group and sex, and assume to be alive at the same calendar year.

2. For each individual

i in a synthetic population set:

(a) Assign him/her a number of co-morbidities Ci based on the probability distribution of the number of comorbidities(b) Repeat until the person has been assigned Ci different co-morbidities (i) Choose a disease sequela

d based on a probability distribution RD(ii) Decide if the person has the disease d based on the probability of having such disease (point prevalence for the population subgroup)

(iii) If the person has the disease:- Remove disease sequela from the list and update probability distribution RDUpdate number of comorbidities assigned to the person5

Slide6

SBOD Simulation

algorithm (cont)

6

(c) Once the person has been assigned

Ci co-morbidities, work out the total co-morbidity adjusted disability weight for the simulant

(d) And the disability weight attributable to each sequela for the simulant

4. Once all individuals have been done work out the YLD Rate for disease sequela k

Slide7

7

SBoD Comorbidity process

Not a full population simulation i.e.

simulated population is 200

000 run the simulation ~1000 times. requires more than 1 year of computer power, that is 20 age groups x 1000 simulations x 40 min per simulation = 800 000 min = 555 days

Or is it enough simulating 2000 people, 1000 times? Take into account probability distribution of the number of co- morbidities by age – with a limit on number of comorbidities (by age group)

Slide8

Source: Barnet et al, 2012 Epidemiology of

multimorbidity

and implications for health care, research, and medical education: a cross-sectional study

Number of chronic disorders by age group

Slide9

SBOD: impact of comorbidity

correction

9

Disease

YLD

comorbidity adjusted YLD% change

Neck and low back pain

44,373 48,184

8

Other

musculoskeletal disorders

37,734

41,104

8

Oral

disorders

29,641

31,556

6

Inflammatory

bowel disease

29,090

32,476

10

Sense

organ diseases

20,831

22,447

7

Migraine

19,632

22,315

12

Depression

19,090

21,123

10

Diabetes

mellitus

18,096

19,639

8

Ischemic

heart disease

16,880

18,309

8

Anxiety

disorders

16,041

17,536

9

Slide10

SBOD supplementary analyses of comorbidity prevalences

Consider whether and how best to exploit the potential of the Scottish evidence:

Estimating the prevalence of comorbidities, to the depth of two or three co-present conditions. Assessing the degree to which the comorbidity prevalences observed in AHS and IHS conform to or depart from the multiplicative independence model.

Making a broad assessment of the degree to which the overall adjustment of YLDs for comorbidity bias might be affected

Slide11

Number of co-existing conditions


Source: Measuring Long-Term Conditions in Scotland, Information Services Division, Edinburgh 2008

https://www.isdscotland.org/Health-Topics/Hospital-Care/Diagnoses/2008_08_14_LTC_full_report.pdf

Slide12

Common combinations of conditions


Source: Measuring Long-Term Conditions in Scotland, Information Services Division, Edinburgh 2008

https://www.isdscotland.org/Health-Topics/Hospital-Care/Diagnoses/2008_08_14_LTC_full_report.pdf

Slide13

Discussion

Comorbidity

Comorbidity adjustment by means of a simulation presents multiple challenges, for instance:

which co-morbidities and how many of them are assigned to a person;

how the disability weights are combined.

GBD

methodology presents a solution to these questions, but is that the best methodology possible?

How can data rich countries use their information to improve the comorbidity adjustment?