Explore
Featured
Recent
Articles
Topics
Login
Upload
Featured
Recent
Articles
Topics
Login
Upload
Search Results for 'Chart-Sample'
Chart-Sample published presentations and documents on DocSlides.
PMS iMOM Color Palette PMS PMS PMS PMS PMS PMS PMS PMS My Chore Chart My Chore Chart My Chore Chart DPLOLUVWOOLJKWVHVHUYHGDPLOLUVWDQGLDUHUHJLVWHUHGWUDGHPDUNV iMOM
by kittie-lecroy
com
Bar Chart You can launch
by morton
Gtplot. from . GSS. to create Bar Charts and oth...
Project Charter START IT!
by kittie-lecroy
By Catherine B. Calio, PMP. Project Charter. Purp...
CHARTER 1661 CHARTER OF 1661 GRANTED BY KING CHARLES II.
by erica
RADICAL IN THE JUDICIAL SYSTEM IS BROUGHT BY THE C...
Internet Re-Charter What is Re-Charter?
by liane-varnes
Renewal of the Chartered Organizations annual com...
Why Charter Government? Charles County Charter Board
by yoshiko-marsland
Charter Board Background. Charles County Commissi...
Charter Party 1 Charter Party
by danika-pritchard
A contract whereby a . shipowner. agrees to plac...
Luxury Yacht Charters Croatia
by thesuperyach
The Superyacht Collection is an exclusive range o...
CHARTER Cargolux offers experience The history of Cargoluxs charter activities goes back to the early s when the company mostly operated charter flights which later on developed into regular services
by test
Until 1995 all charter flights were operated on C...
Sample Sample Sample Sample Sa
by lois-ondreau
brPage 1br Sample brPage 2br Sample brPage 3br Sam...
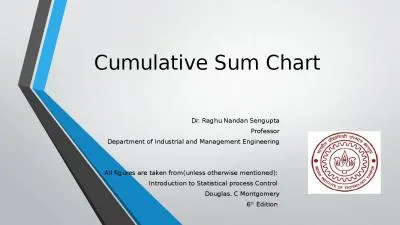
Cumulative Sum Chart Dr.
by barbara
Raghu . Nandan. . Sengupta. Professor. Department...
Attribute Control Chart
by isabella2
Dr.. Raghu . Nandan. . Sengupta. Professor. Depa...
Effective Visuals Using Graphs, Tables, Charts, and illustrations in Technical Reports
by smith
S. Last ENGR 120. VISUALS. Capture and hold . peo...
Managing Quality Chapter 3
by ani
Quality and Performance. Quality. A . term used by...
Make More Sense of Your Environmental Data with
by belinda
the. Branch of Quality System’s . Blind-Sample P...
Statistical Process Control
by lois-ondreau
Operations Management. Dr. . Ron . Lembke. Design...
Statistical Process Control
by conchita-marotz
Managing . for Quality. Dr. Ron . Lembke. Goal of...
Statistics and Data Analysis
by jane-oiler
Professor William Greene. Stern School of Busines...
Sampled Channel Testing What are Sampled Channels?
by christina
Sampled channels are similar to analog channels in...
a sample then that sample will be representative of the population Its
by olivia
attached to them The computer using a procedure ca...
Sample headline Sample Accent Copy
by faustina-dinatale
Sample headline. Sample Accent Copy. Sample headl...
SAMPLE PAGES SAMPLE PAGES SAMPLE PAGES S
by tawny-fly
brPage 1br SAMPLE PAGES brPage 2br SAMPLE PAGES br...
SAMPLE PAGES SAMPLE PAGES SAMPLE PAGES S
by danika-pritchard
brPage 1br SAMPLE PAGES brPage 2br SAMPLE PAGES br...
School Board Forum on Charter Schools and the City School Portfolio June 7, 2010
by grady822
and. the City School Portfolio. June 7, 2010. 1. E...
OKLAHOMA CHARTER SCHOOLS ACT
by dawson408
Brad Clark. General Counsel. Oklahoma State Board ...
Calumet College of St. Joseph Annual Charter School Report
by kye
Annual Charter School Report. Schools: Charter Sc...
The Project Charter
by asa
Presented by Mark . Troncone. , MBA, . PMP. ®. ,...
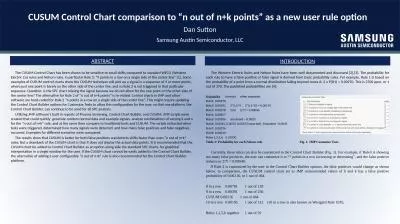
CUSUM Control Chart comparison to “n out of
by fanny
n+k. . points” as a new user rule option. Dan S...
National Zone Charts Matrix
by natalie
Overview. November 13, 2018 . Including. Integrati...
Pareto Chart QM 2017 2/1/2017
by brown
Lean Six Sigma. 1. What is Pareto Chart?. A . Pare...
Pop charts are dominated by Big Band artists such as Doris Day, Frank Sinatra, Nat King Cole
by jainy
RnB. charts feature African-American artists play...
Charter Schools and Title I-A
by obrien
April 25, 2023. Charter Schools in Oregon. Charter...
Draft Charter Community of Practice for Direct Access Entities
by delcy
General Overview. Draft Charter. General Aspects. ...
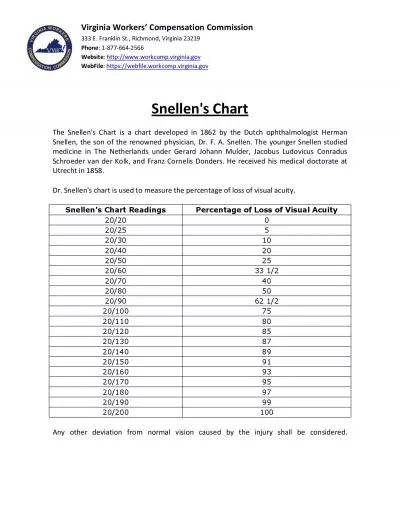
Snellens Chart
by eliza
The Snellen's Chart is a chart developed in 1862 b...
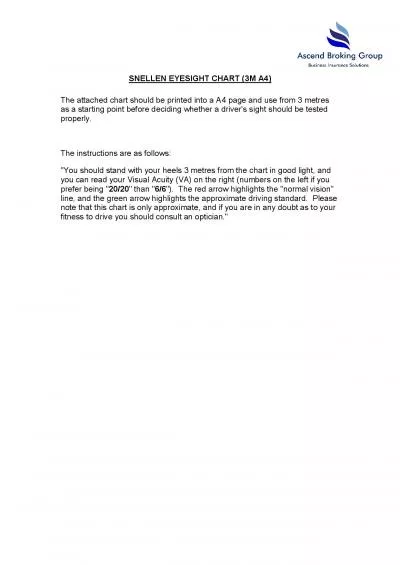
SNELLEN EYESIGHT CHART
by molly
3M A4 ) The attached chart should be printed into ...
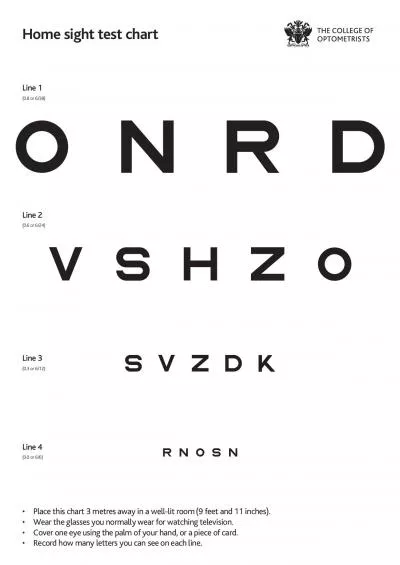
Home sight test chart
by caroline
•lace this chart 3 metres in a well-lit room(...
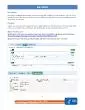
Bar ChartsDescriptionA bar chart is a graphical representation of data
by williams
1 To access the report, select Analysi�sRe...
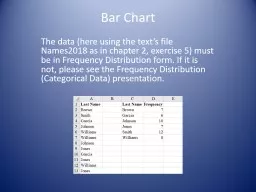
Bar Chart The data (here using the text’s file Names2018 as in chapter 2, exercise 5) must be in
by blanko
Bar Chart. Click on the Insert tab. Select cells C...
We are often asked about the funding for public charter schools in Tex
by jones
2Independent School Districts ISDs151with all of t...
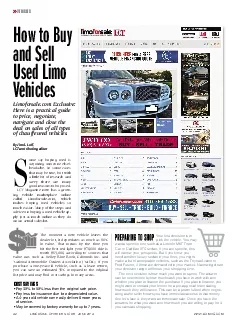
LIMOUSINE CHARTER TOUR JUNE 2014WWWLCTMAGCOM
by melanie
LIMOUSINE CHARTER TOUR JUNE 2014LIMOUSINE CHART...
Load More...