Explore
Featured
Recent
Articles
Topics
Login
Upload
Featured
Recent
Articles
Topics
Login
Upload
Search Results for 'charts chart'
charts chart published presentations and documents on DocSlides.
Bar Charts Objectives By the end of this section, students should be able to:
by julia
represent data in a bar chart. .. Use a chart.. Ba...
1 Determining Effective Data Display with Charts
by cheryl-pisano
Chart Types Covered. 2. Column. Line. Pie. Stock....
1 Determining Effective Data Display with Charts
by celsa-spraggs
Chart Types Covered. 2. Column. Line. Pie. Stock....
Pie Charts
by calandra-battersby
Hmmmmm. ..Pie!. Pie Charts. WALT. Can you read a ...
Attribute Control Chart
by isabella2
Dr.. Raghu . Nandan. . Sengupta. Professor. Depa...
BAR CHART
by min-jolicoeur
Paweł Bilski. Piotr Mazur. Paulina Wawryca. Defi...
Spreadsheet Contd.. Charts
by obrien
Chart is a . visual representation of data from a ...
Initial Experience with Charts in JavaFX
by mindeeli
M. Gonzalez Berges. Context . Linac. 4 BPM expert...
Smart Org Charts in Microsoft Office 365: Securely Create, Collaborate, Edit, and Share Org Charts
by luanne-stotts
OFFICE 365 APP BUILDER PROFILE: . BrightArch. Bri...
CREATING BETTER CASCADE CHARTS
by tawny-fly
David Goldstein. February, 2018. Types of Cascade...
The Power of Anchor Charts to Transform Reading Instruction
by liane-varnes
Erin Gates. How can anchor charts help you improv...
Flow Charts What are they and why do we use them?
by tawny-fly
What is a Flow Chart?. TO UNDERSTAND WHAT FLOW CH...
Graphs and Charts
by conchita-marotz
Curriculum links and teaching notes. For L1-L2 Ad...
CHORD CHARTS
by tawny-fly
The following presentation is designed to help yo...
Strategy Consultants toolkit
by fernando493
SELLING YOUR IDEAS WITH POWERFUL CHARTS. Introduct...
Miranda Li Design & Data Visualization Lead
by lauren
Microsoft Consumer Data and Analytics Team. Simply...
Presenting Data IMGD 2905
by martin
Chapter 2. 2. Types of Variables. Qualitative (Cat...
Essential QI Tools Review of
by finley
QI 104: Interpreting Data: Run Charts, Control Cha...
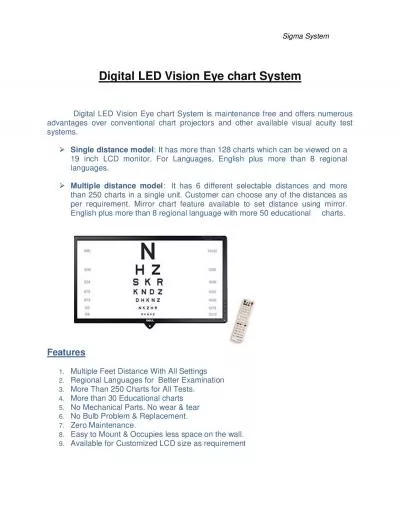
Sigma System
by everly
Digital LED Vision Eye chart System Digital LED Vi...
Pedigree Charts The family tree of genetics
by deena
Overview. What is a pedigree? . Definition. Uses...
Make Better Charts Kristin Briney
by cadie
BBE Librarian. https://xkcd.com/1798/. It’s not ...
Environmental Sensing Monitoring and Analyzing Water Temperatures
by iainnoli
Mark . Caruso, . Joseph A. Hassan, Leanne Denise ....
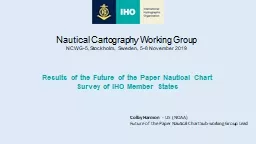
Nautical Cartography Working Group
by liane-varnes
NCWG-5, Stockholm, Sweden, 5-8 November 2019. Res...
Aeronautical Charts What’s a Chart? Map provided by the FAA or
by marina-yarberry
Aeronautical Charts What’s a Chart? Map provide...
Technical Analysis? What is it?
by celsa-spraggs
How can I profit?. Slides prepared for ATAA use. ...
Charts and Graphs V105.01
by tatyana-admore
Types of Charts and Their Uses. Why create charts...
Charts and Graphs EDC&I 583
by danika-pritchard
Message Design. 8 February 2012. This Evening’s...
Weighted moving average charts for detecting small shifts in process mean or trends
by calandra-battersby
The wonders of JMP. 1. Shifts in the Process Mean...
Industrial Facilities Design
by lois-ondreau
7. th. Term, . Batch:2010. 15/03/2013. 1. Lect#3...
Learning Objectives for Unit-5
by phoebe-click
After careful study of this chapter, you should b...
The 7 Basic Tools of Quality
by test
(Ishikawa Tools of Quality). FREE Professional De...
Pedigree Charts
by calandra-battersby
The family tree of genetics. Overview. What is a ...
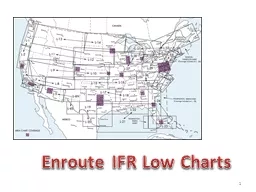
Enroute IFR Low Charts
by giovanna-bartolotta
1. IFR Charts. IFR Low. IFR High (above 18,000). ...
NAUTICAL CHARTS
by tatyana-admore
I. Purpose of Nautical Charts. Nautical charts a...
Interactive
by mitsue-stanley
Anchor Charts. Kelly Martin. Morgan . Womick. Mar...
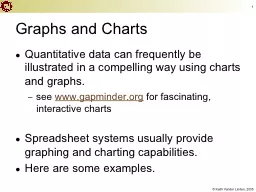
1 Graphs and Charts
by alexa-scheidler
Quantitative data can frequently be illustrated i...
1 Graphs and Charts
by min-jolicoeur
Quantitative data can frequently be illustrated i...
2012 National BDPA Technology Conference
by ellena-manuel
Creating Rich Data Visualizations using the Googl...
Presenting
by conchita-marotz
Data . with Excel. D.A. Whatley (SMG ‘15) – ...
A Flexible Statistical Control Chart
by cheryl-pisano
for . Dispersed Count . Data. Kimberly F. Sellers...
Load More...