Explore
Featured
Recent
Articles
Topics
Login
Upload
Featured
Recent
Articles
Topics
Login
Upload
Search Results for 'Graphing'
Graphing published presentations and documents on DocSlides.
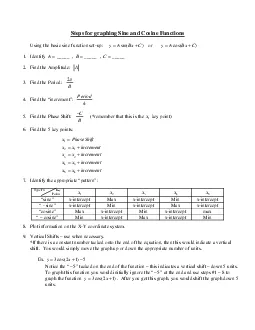
Steps for graphing Sine and Cosine Functions
by valerie
Using the basic sine sinyABxC or cosyABxC1 ...
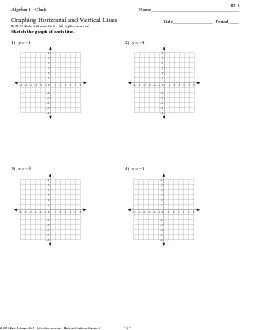
Worksheet by Kuta Software LLC
by felicity
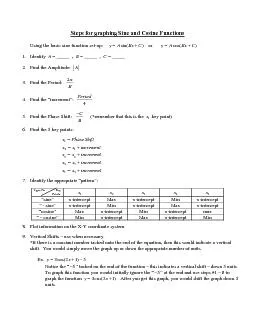
Steps for graphing Sine and Cosine Functions
by fiona
Using the basic sine sin()yABxC or cos()...
Portable Nutrient Data Collection System
by groundstimulus
May1719. Dr. Daji . Qiao – Advisor. Dr.. Long Q...
Breakeven Point When you make a product, you need to know how many you need to make and sell to mak
by unisoftsm
This critical point is known as the Breakeven Poin...
PreCalc /Trig 4.4a/b CO: SWBAT generate the graphs of the sine and cosine functions and explore va
by taxiheineken
transformations of these graphs. LO: SWBAT state t...
Physics kinematics and graphing
by doggcandy
Day 1. Warm – Up:. Choose a new seat with . diff...
Graphing Sine and Cosine
by olivia-moreira
Graphing Sine and Cosine Keeper 13 Accelerated P...
Ch. 9 Motion Describing Motion
by aaron
. Motion. Speed & Velocity. Acceleration. ...
Analyze Graphs of Polynomial Functions
by min-jolicoeur
Objectives:. To approximate . x. -intercepts of a...
4.2-2 Constructing Polynomial Functions
by test
Now, we have learned about several properties for...
Solve Linear Systems by Graphing
by karlyn-bohler
A “System” is a . set of equations.. A . Line...
4.4 Graphing sin and cos Functions
by alexa-scheidler
5–Minute Check 1. Let (–5, 12) be a point on ...
3.7 Graphing Absolute Value Functions
by sherrill-nordquist
How do the value of . a. , . h. , and . k. , affe...
Algebra unit 4: Graphs of equations and functions
by aaron
Unit 4 PowerPoint. The coordinate Plane. The coor...
2D Plots 2 ENGR 1181 MATLAB 13
by myesha-ticknor
Plotting in the Real World. 2D plots generated by...
Introduction to Graphing in SAS
by briana-ranney
Greg Grandits, Division of Biostatistics. March 6...
3-5 Graphs in Three Dimensions
by jane-oiler
Objective: To graph points and equations in three...
Graphing Station Lab Summary of Stations
by test
1. English Usage-- Assess a Graph [tadpoles]. 2...
Solving Quadratic Equations
by sherrill-nordquist
Tammy Wallace. Varina High. What is a Quadratic E...
Intro to Systems of Equations and Graphing
by natalia-silvester
b. y. Tammy Wallace. What is a System of Equation...
Graphing Picture and Bar Graphs
by ellena-manuel
By . Giovanna Giurdanella. November 29. th. , 201...
Inequalities Graphing and solving
by tatyana-admore
Inequality Symbols. < . > . ...
Glencoe High School Mathematics
by pasty-toler
Course Offerings and Forecasting Information. Int...
Review Graphing Linear Equations
by giovanna-bartolotta
A review of sections 4.2, 4.3, and 4.5 . Mike . H...
Solving quadratic equations by graphing and factoring
by mitsue-stanley
Warm Up. Find the . x. -intercept of each functio...
Linear Systems and Matrices
by karlyn-bohler
Algebra 2. Chapter 3. This Slideshow was develope...
GRAPHING OF MOTION ANSWER KEY
by myesha-ticknor
6. TH. GRADE . © . Copyright 2014- all rights ....
Do Now! Evaluate each expression for a = -1, b = 3, and c = -2.
by aaron
1) 2a – b. 2. c. 2) . b. 2. – 4ac. ...
Post-lab: Graphing Motion
by aaron
Uniform Motion and Uniform Accelerated Motion. Re...
Statistics Describing Data Using Tables and Graphs
by olivia-moreira
Assignment 2. Example Problems. Frequency Distrib...
Graphing America’s Rising Industrialism
by cheryl-pisano
US History Honors . Directions for Completing Act...
Graphing in Excel Did someone say
by aaron
Giraffing. in Excel?. No, that would be . graphi...
Uniform Motion and Graphing
by tatiana-dople
Uniform motion . – objects travel equal displac...
Graphing Data Using excel
by lindy-dunigan
2. nd. Grade. Overview. Excel Project- Graphing....
Today’s Agenda Rates and Ratio Quiz
by yoshiko-marsland
Evaluating Inequalities. Solving Inequalities. Ma...
Graphing skills Graphs A graph shows trends in measurements even more clearly than tables do.
by alexa-scheidler
The type of graph you draw depends on the types o...
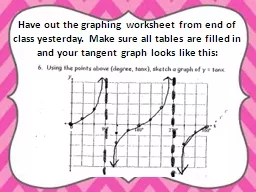
Have out the graphing worksheet from end of class yesterday
by myesha-ticknor
Goals for today:. Graph sine, cosine and tangent ...
Grasping Graphing
by calandra-battersby
Solutions to Understanding . and Presenting Data....
2017 AP
by marina-yarberry
®. Preadministration Session. 2. What Students ...
Load More...