Explore
Featured
Recent
Articles
Topics
Login
Upload
Featured
Recent
Articles
Topics
Login
Upload
Search Results for 'Histogram-Path'
Histogram-Path published presentations and documents on DocSlides.
Histograms Using a histogram to estimate the median
by trish-goza
Mark. 0 –20. 20 –30. 30 –35. 35 –45. 45 �...
Histograms and composites
by trish-goza
multimodal is always interesting. qualitative dis...
Histogram Equalization
by phoebe-click
Image Enhancement: Histogram Based Methods. · . ...
Histogramnormal (10,1)
by faustina-dinatale
8910111213 Count 246121416 Count Histogramnormal ...
20+ Stunning Garden Path Ideas Using Natural Stones
by worldofstonesusa
Transform your outdoors with 20+ stunning garden p...
yimo.guo@ee.oulu.fi
by stefany-barnette
22.09.2011 . Digital Image Processing . Exercise ...
Feature descriptors and matching
by paige
Basic correspondence. Image patch as descriptor, N...
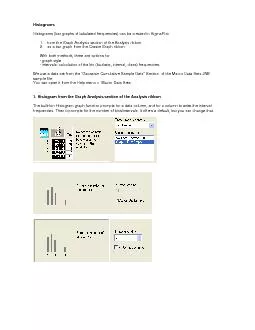
Histogram The data must be in Frequency Distribution (see presentation if needed) form for Excel to
by bitsy
Make your Frequency Distribution active.. Histogra...
Filters and Histogram 1
by evelyn
Images. x. y. f(x, y). row. column. Sample. Quanti...
A histogram is a graphical representation of the distribution of data.
by zoe
It is an estimate of the probability distribution ...
predictioncanbeusedasamethodformergingtheresultsofqueriesperformedondi
by natalie
MAP(maximizingKendall's- betweenestimatedandac...
Image Enhancement Image enhancement refers to the class of image processing operations whose goal i
by greyergy
The relevant features for the examination task are...
4.2 Displays of Quantitative Data
by laobeast
Stem and Leaf Plot. A . stem-and-leaf plot. . sho...
ROOT: Functions & Fitting
by volatilenestle
Harinder. Singh . Bawa. California State Universi...
© David Kirk/NVIDIA and Wen-
by phoebe-click
mei. W. . Hwu. University of Illinois, 2007-20...
CS448f: Image Processing For Photography and Vision
by yoshiko-marsland
Fast Filtering Continued. Filtering by . Resampli...
Today’s Lesson: What:
by jane-oiler
. analyzing graphs and histograms. Why: . ....
More Chapter 3! (or Chapter 4)
by phoebe-click
Brave New Data. We are no longer limited to chart...
Reversible Data Hiding ECE643 Digital Image Processing (I) Course Project
by kittie-lecroy
Professor: Yun Q. Shi. Su Yu. 1. 2/02/2011. Conte...
HOW-113 Exploring Sampling Distributions with SAS Studio: An Activity for Statistics Educators
by calandra-battersby
Jonathan W. Duggins; James Blum. NC State Univers...
Chapter 4 Displaying & Summarizing Quantitative Data
by alexa-scheidler
Histograms. Similar to bar charts, but with quant...
Fast GPU Histogram Analysis for Scene Post-Processing
by natalia-silvester
Andy Luedke. Halo Development Team. Microsoft Gam...
Introduction to Matlab
by min-jolicoeur
Module #7 – Statistics. Topics. Statistics. His...
Reversible Data Hiding
by luanne-stotts
using. Histogram Shifting. Sai Saketh . Nandagiri...
Chapter 3: Displaying and Summarizing Quantitative Data
by tawny-fly
Part 1 . Pg. 43-53. When dealing with a large da...
Chapter 4: Describing Numerical Data
by stefany-barnette
Homework #3. Chapter . 4 . Problem . 54. Cars. A ...
Special Topic on Image Retrieval
by karlyn-bohler
2014-03. Popular Visual Features. Global feature....
CRIB
by marina-yarberry
Anapaw. . I. nductory. Manual. Yuji . Sakaguchi...
Radiometric
by giovanna-bartolotta
Preprocessin. g: Atmospheric Correction. . “Co...
Part 4: Data Dependent Query Processing Methods
by briana-ranney
Yin “David” Yang . . Zhenjie. Zhang. . ...
Histogram Equalization Histogram equalization is a technique for adjusting image i ntensities to enhance contrast
by tawny-fly
Let be a given image represented as a by matrix o...
Comparing Images Using Joint Histograms Greg Pass Ramin Zabih Computer Science Department Cornell University Ithaca NY gregpassrdz cs
by jane-oiler
cornelledu 6072558413 Abstract Color histograms ar...
Classification of the aesthetic value of images based on hi
by tatyana-admore
features. By Xavier Clements & Tristan Penman...
Anderson VMC DPH31G
by jane-oiler
Understanding Histograms. Histograms are a graphi...
Multiple Window for Image Contrast Enhancement
by liane-varnes
By Solomon Jones. 1. OVERVIEW. 2. INTRODUCTION. L...
ORACLE COST-BASED OPTIMIZER ADVANCED
by kittie-lecroy
Randolf. Geist. http://oracle-randolf.blogspot.c...
AP Statistics
by natalia-silvester
CH. 4 Displaying Quantitative Data. By. Jamie Mor...
Chapter 4:
by faustina-dinatale
Displaying & Summarizing Quantitative Data. A...
Basis
by mitsue-stanley
beeldverwerking. (8D040). dr. Andrea Fuster. Pro...
Point Processing
by sherrill-nordquist
Histograms. Histogram Equalization. Histogram equ...
Load More...