Explore
Featured
Recent
Articles
Topics
Login
Upload
Featured
Recent
Articles
Topics
Login
Upload
Search Results for 'Visualization'
Visualization published presentations and documents on DocSlides.
Feature Emphasis and Contextual Cutaways for Multimodal Medical Visualization
by melody
Michael Burns. Martin . Haidacher. Eduard . Gröll...
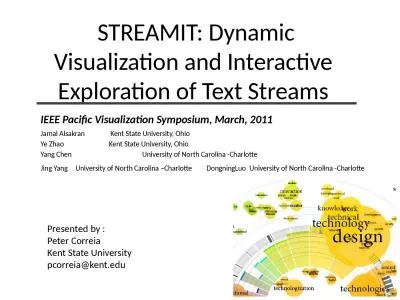
STREAMIT: Dynamic Visualization and Interactive Exploration of Text Streams
by davis
Jamal . Alsakran. . Kent . State Univers...
Visualization Foundations
by morgan
Cherdyntsev E.S.. We have now covered the start an...
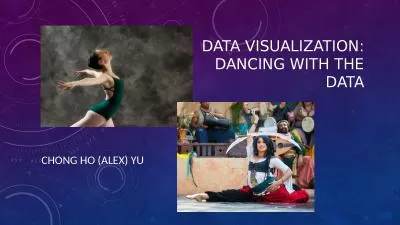
Data visualization: Dancing with the data
by emery
Chong Ho (Alex) Yu. Agenda. What is data visualiza...
Vol 1 No1 2005 003017 Rinton PressMUVA A FLEXIBLE VISUALIZATION ARC
by daniella
4 MUVA a Flexible Visualization Architecture ...
Ali Sarvghad Data Visualization & Exploration – COMPSCI 590
by envrrolex
Spring 2018. Course Introduction. What the course ...
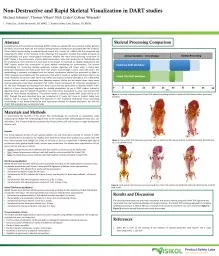
Non-Destructive and Rapid Skeletal Visualization in DART studies
by joyousbudweiser
Michael Johnson. 1. , Thomas Villani. 1, . Nick Cr...
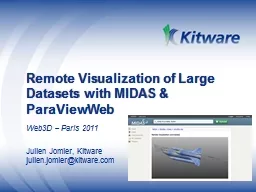
Remote Visualization of Large Datasets with MIDAS &
by slayrboot
ParaViewWeb. Web3D – . Paris 2011. Julien. . Jo...
Research for a reason. CHARTS AND VISUALIZATIONS
by kittie-lecroy
Percentage of Total NSF . Research . Funding. YEA...
Simplified Solar Power Plant Visualization For
by calandra-battersby
iPhone. Capstone Team#5. Fall 2009. Table of Cont...
Software Visualization for Debugging
by alexa-scheidler
Representing programs through algorithm animation...
Oracle Data Visualization Content in Oracle Fusion Applications Cloud Service
by debby-jeon
David Granholm. , Senior Director PM . Matt Milel...
Creating a Data Visualization using Tableau Public
by tawny-fly
Starting up the Program. 2. Creating a Data Visua...
October 29, 2014 Visualization
by stefany-barnette
Databases, continued. What kind of power do visua...
SIRISHA Best data visualization software
by myesha-ticknor
Creates interactive visualization . and dashboard...
Creative Visualization
by danika-pritchard
Week . 9 . NJ Kang. What is creative visualizatio...
A Quick Guide to Visualization
by jane-oiler
Yingcai Xiao. Computation with and without Visual...
Back-End Structures and Front End Visualizations
by lindy-dunigan
DAMA Minnesota. Matthew Israelson. 19 November, 2...
Scientific Visualization with VisIt
by celsa-spraggs
Eliot Feibush. Plasma Princeton Physics Laborator...
Assisting Visualization System
by natalia-silvester
Zhonghua. . Qu. and . Ovidiu. . Daescu. Decemb...
Data Visualization Project
by mitsue-stanley
B.Tech Major Project. Project Guide. Dr. . Naresh...
Visualization Knowledge Query Language (VKQL) Workshop
by danika-pritchard
Nicholas Del . Rio. University of Texas at El Pas...
Data Science and Visualization
by jane-oiler
2014 Summer Internship - Tetherless World Constel...
Miranda Li Design & Data Visualization Lead
by lauren
Microsoft Consumer Data and Analytics Team. Simply...
BLACK HOLES SIMULATION and visualization
by reagan
Maria Babiuc-Hamilton. Department of Physics. Ma...
Aliakbar Jafarpour jafarpour.a.j@ieee.org
by brown
Imaging Facility, ZMBH, University of Heidelberg. ...
Cancer Data Science 101:
by olivia
Data Science Methodology. Randy Johnson, PhD. Adva...
Data Visualization Data visualization is Communication
by lucinda
Principles of Graphical Excellence. Clarity. Preci...
Antonio Segura – University of Detroit Mercy
by nicole
Supervisor: Bruno Coimbra – Fermilab. SIST/GEM F...
Data Visualization Data visualization
by davis
When working with data, it is often useful to disp...
Reading Contour Maps (Including Topographic Maps):
by badra
Visualizing 3D Surfaces. Carol J. Ormand. , . SERC...
SEEING IS BELIEVING: Telling stories with statistics – in pictures
by skylar
We’re failing. . Do you see the same thing he...
High Performance Dimension Reduction and Visualization for Large
by bella
High-dimensional Data Analysis. Jong Youl Choi, . ...
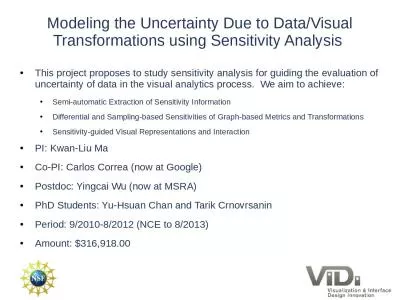
Modeling the Uncertainty Due to Data/Visual Transformations using Sensitivity Analysis
by tracy
This project proposes to study sensitivity analysi...
DESIGN AND FABRICATION OF TACTILE INTERFACE FOR PALPATION
by mary
Project By: Amrita Krishnaraj. Mentors: Dr. Nitish...
[READING BOOK]-Practical Python Data Visualization: A Fast Track Approach To Learning Data Visualization With Python
by cardalemaison
The Desired Brand Effect Stand Out in a Saturated ...
[FREE]-Practical Python Data Visualization A Fast Track Approach To Learning Data Visualization With Python
by mikealjaydrien
The Desired Brand Effect Stand Out in a Saturated ...
Beginners Guide to Data Visualization: How to Understand, Design, and Optimize Over 40 Different Charts (Guides for Data Analytics, Data Visualization, and Communicating Data)
by judenmasson
It’s no secret that this world we live in can be...
x0000x0000VisualizationGuided Imagery continued x0000x00
by kimberly
Information from your Patient Aligned Care Team V...
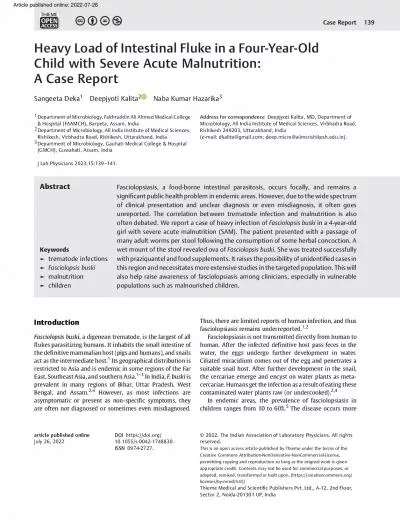
Article published online 20220726
by badra
commonlyinschool-agedchildren;however,manyauthorso...
Load More...


![[READING BOOK]-Practical Python Data Visualization: A Fast Track Approach To Learning Data Visualization With Python](https://thumbs.docslides.com/975259/reading-book-practical-python-data-visualization-a-fast-track-approach-to-learning-data-visualization-with-python.jpg)
![[FREE]-Practical Python Data Visualization A Fast Track Approach To Learning Data Visualization With Python](https://thumbs.docslides.com/970645/free-practical-python-data-visualization-a-fast-track-approach-to-learning-data-visualization-with-python.jpg)