PPT-Dilution series Calibration curve of human EN peptide
Author : shangmaxi | Published Date : 2020-06-23
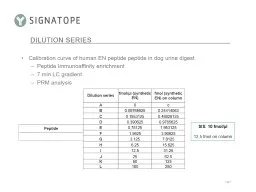
peptide in dog urine digest Peptide Immunoaffinity enrichment 7 min LC gradient PRM analysis Dilution series fmol µl synthetic EN fmol synthetic EN on column
Presentation Embed Code
Download Presentation
Download Presentation The PPT/PDF document "Dilution series Calibration curve of hu..." is the property of its rightful owner. Permission is granted to download and print the materials on this website for personal, non-commercial use only, and to display it on your personal computer provided you do not modify the materials and that you retain all copyright notices contained in the materials. By downloading content from our website, you accept the terms of this agreement.
Dilution series Calibration curve of human EN peptide: Transcript
Download Rules Of Document
"Dilution series Calibration curve of human EN peptide"The content belongs to its owner. You may download and print it for personal use, without modification, and keep all copyright notices. By downloading, you agree to these terms.
Related Documents