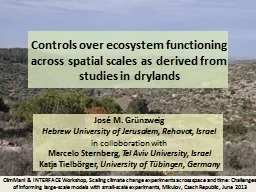
spatial scales as derived from studies in drylands Jos é M Grünzweig Hebrew University of Jerusalem Rehovot Israel in colloboration with Marcelo Sternberg Tel Aviv University ID: 715296
Download Presentation The PPT/PDF document "Controls over ecosystem functioning acro..." is the property of its rightful owner. Permission is granted to download and print the materials on this web site for personal, non-commercial use only, and to display it on your personal computer provided you do not modify the materials and that you retain all copyright notices contained in the materials. By downloading content from our website, you accept the terms of this agreement.
Slide1
Controls over ecosystem functioning across
spatial scales as derived from studies in drylands
José M. Grünzweig Hebrew University of Jerusalem, Rehovot, Israel in colloboration withMarcelo Sternberg, Tel Aviv University, IsraelKatja Tielbörger, University of Tübingen, Germany
ClimMani
& INTERFACE Workshop,
Scaling climate change experiments
across space and time:
Challenges
of informing large-scale
models
with
small-scale
experiments
,
Mikulov
, Czech Republic, June 2013Slide2
Climate anomalies, Europe, summer 2003
Ciais et al. 2005 Nature
Climate extremes in systems not adapted to those extremesSlide3
Global extent of drylands
Levant (SE Mediterranean)
Research in regions adapted to heat and/or droughtSlide4
Climate
The physical properties of the Levant (SE Mediterranean)Slide5
Shrubland as spatially heterogeneous, mosaic-type ecosystem composed of different microsites
The physical properties of the Levant (SE Mediterranean)
Biomes/ecosystem typesSlide6
Outline of questions
Can we predict ecosystem functioning across a precipitation range with common biological and
abiotic drivers?What processes control carbon pools and fluxes when it gets drier?Do climate-change experiments reveal tipping points in ecosystem structure and functioning?What can we learn from climate-extremes studies in drylands?Where are we going from here?Slide7
Rainfall manipulations along an aridity gradient
Aridity gradient – GLOWA Jordan River project
South facing slopesshallow soil (Terra Rossa to lithosol) onsimilar bedrockSimilar seasonal temperture rangeEight-fold difference in mean annual rainfallLarge difference in rainfall variability
Mediterranean: 540 mm,
CV 30%
Semiarid: 300 mm,
CV 37%
~ 245 km
Arid: 90 mm,
CV 51%
Mesic Mediterranean: 780 mm,
CV 22%
Biomes/ecosystem typesSlide8
300 mm
Semiarid
550 mmMediterranean
-30
%
+30
%
Experimental rainfall manipulations
Control
Rainfall manipulations
Rainfall manipulations along an aridity gradientSlide9
Observed
R
s (μmol m-2 s-1)Predicted Rs (μmol m-2 s-1)r2 = 0.48Talmon et al. 2011 GCB
Soil respiration at the herbaceous
microsite
during the growing season?
Prediction:
R
s
= soil respiration;
T
s
= soil temperature;
θ
= soil moisture
Site- and treatment- specific equations
better fits
Overall inter-site and inter-treatment controls?
Can we predict ecosystem functioning across a precipitation range with common biological and
abiotic
drivers?
two
sites, three climate-change
treatmentsSlide10
Observed
R
s (μmol m-2 s-1)Predicted Rs (μmol m-2 s-1)r2 = 0.48Ts
,
θ
Observed
R
s
(
μ
mol
m
-2
s
-1
)
r
2
= 0.73
T
s
,
θ
, cover
Predicted
R
s
(
μ
mol m
-2 s-1)Vegetation cover is a factor that explains part of the inter-site and inter-treatment variation in soil respiration climate change modelingAddition of vegetation cover as a driver of soil respirationPrediction of ecosystem functioning with common biological and abiotic drivers?Slide11
Talmon
et al. 2011 GCB
What processes control carbon pools and fluxes when it gets drier?Soil organic carbon stocks at the herbaceous microsite along the aridity gradientSlide12
What processes control carbon pools and fluxes when it gets drier?
Carbon loss
Carbon additionSlide13
Changes in plant strategies
with increasing aridity
Mean annual precipitation (mm)Unweighted community mean
300
780
550
90
300
780
550
90
Mean annual precipitation (mm)
Sternberg &
Lebrija
What processes control carbon pools and fluxes when it gets drier?Slide14
Alternative drivers of litter decay in the dry season
What processes control carbon pools and fluxes when it gets drier?
Dirks et al. 2010 GCB
Dew
Water
vapor
< saturation
Solar radiationSlide15
To what extent is soil respiration along the aridity gradient directly controlled by
changes in climatic variables and indirectly controlled by shifts in shrub cover?
What processes control carbon pools and fluxes when it gets drier?Slide16
13% 35%
55% 75%
Shrub
cover
-15%
-12%
-21%
-20%
-60%
-64%
What processes control carbon pools and fluxes when it gets drier?Slide17
Kigel
& Konsens
Do climate-change experiments reveal tipping points in ecosystem structure and functioning?Slide18
Do climate-change experiments reveal tipping points in ecosystem structure and functioning?
Sternberg &
NavonSlide19
Talmon
et al.
2011 GCBDo climate-change experiments reveal tipping points in ecosystem structure and functioning?Slide20
Rainfall manipulations had
no significant effect on species diversity at the semiarid site (same for the Mediterranean site)
Kigel et al., unpublishedYearYear ***
Treatment NS
T x Y *
Year ***
Treatment NS
T x Y *
Do climate-change experiments reveal tipping points in ecosystem structure and functioning?Slide21
Species richness
Species evenness (J’)
Mediter.
arid
mesic Mediter.
semiarid
Station *** Year ***
S x Y
***
Station *** Year ***
S x Y **
Station *** Year ***
SxY
**
Species diversity (H’)
Do climate-change experiments reveal tipping points in ecosystem structure and functioning?
Species diversity along the aridity gradientSlide22
What can we learn from climate-extremes studies in
drylands
?Rs = soil respiration; Ts = soil temperature; θ = soil moisture; PPFD = photon flux density
Moist season:
Dry season:
R
s
Grünzweig et al. 2009 JGRSlide23
R
s
Testing extreme conditions: irrigation during the hot summerRs = soil respiration; Ts = soil temperature;
θ
= soil water content;
PPFD
= photon flux density
Predictions
Irrigation:
Control:
Grünzweig et al. 2009 JGRSlide24
Katja Geissler, Martin Köchy, Florian Jeltsch, Dan Malkinson
Scaling of output: the model Wadiscape
topographic and
Spatial information
GIS
slopes (DEM)
MAP
(characterization of region by mean annual precipitation )
1.0 km
geographic variation
Experiments (GLOWA)
Surveys (GLOWA)
Literature
Experts (GLOWA)
global circulation models
pattern (GLOWA)
Modeling (semi-) natural vegetationSlide25
Katja Geissler, Martin Köchy, Florian Jeltsch
Modeling (semi-) natural vegetation
(Over)grazed vegetation is highly vulnerable to climate change
climate change
climate change, moderate grazing
climate change, current grazingSlide26
Summary
Vegetation cover
is a driver of soil respiration together with climatic drivers.The relative distribution of vegetation types has a small impact on ecosystem-scale soil respiration under a drier climate; the decrease in soil respiration is mainly driven by the decline in biological activity.The decrease in soil organic carbon storage with increased aridity is related to greatly reduced productivity and less drastically reduced decomposition; alternative drivers start to become important under drier conditions.
Climate change studies might reveal
tipping points
in
species richness
.Slide27
Where are we going from here?
Climate-change studies in
systems adapted to drought provide better understanding of ecosystem functioning under more realistic conditions Climate-extremes studies, even unrealistic ones, can teach us about processes and potentially about thresholds and tipping pointsSlide28
Funding sources
International Arid Lands Consortium(IALC
) Climate Change and Impact Research: the Mediterranean Environment (CIRCE) (EU FP6)German Federal Ministry of Education and Research (BMBF)Israeli Ministry of Science and Technology (MOST)CollaboratorsHebrew University Tel Aviv University Haifa UniversityJaime Kigel Yael Navon Dan MalkinsonYiftach Talmon Edwin LebrijaIrit KonsensRita Dumbur
AcknowledgementsSlide29
Thank you for your attention!