/
Curve fit metrics Curve fit metrics

Curve fit metrics - PowerPoint Presentation

sherrill-nordquist
sherrill-nordquist . @sherrill-nordquist
Follow
410 views
Uploaded On 2017-04-18

Curve fit metrics - PPT Presentation

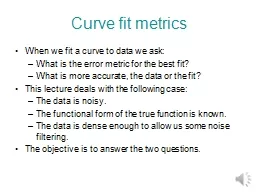
When we fit a curve to data we ask What is the error metric for the best fit What is more accurate the data or the fit This lecture deals with the following case The data is noisy The functional form of the true function is known ID: 538966

data fit curve regression fit data regression curve noise points difference polynomial linear functional rms err surrogates error0 point

Share:

Link:

Embed:

Download Presentation from below link

Download Presentation The PPT/PDF document "Curve fit metrics" is the property of its rightful owner. Permission is granted to download and print the materials on this web site for personal, non-commercial use only, and to display it on your personal computer provided you do not modify the materials and that you retain all copyright notices contained in the materials. By downloading content from our website, you accept the terms of this agreement.


Presentation Transcript

Slide1

Curve fit metrics

When we fit a curve to data we ask:What is the error metric for the best fit?What is more accurate, the data or the fit?This lecture deals with the following case:The data is noisy.The functional form of the true function is known.The data is dense enough to allow us some noise filtering.The objective is to answer the two questions.Slide2

Curve fit

We sample the function y=x (in red) at x=1,2,…,30, add noise with standard deviation 1 and fit a linear polynomial (blue).How would you check the statement that fit is more accurate than the data?With dense data, functional form is clear. Fit serves to filter out noiseSlide3

Regression

The process of fitting data with a curve by minimizing the mean square difference from the data is known as regressionTerm originated from first paper to use regression dealt with a phenomenon called regression to the mean http://www.jcu.edu.au/cgc/RegMean.html The polynomial regression on the previous slide is a simple regression, where we know or assume the functional shape and need to determine only the coefficients.Slide4

Surrogate (

metamodel)The algebraic function we fit to data is called surrogate, metamodel or approximation.Polynomial surrogates were invented in the 1920s to characterize crop yields in terms of inputs such as water and fertilizer.They were called then “response surface approximations.”

The term “surrogate” captures the purpose of the fit: using it instead of the data for prediction.

Most important when data is expensive and noisy, especially for optimization.Slide5

Surrogates for fitting simulations

Great interest now in fitting computer simulationsComputer simulations are also subject to noise (numerical)

Simulations

are

exactly repeatable

, so noise is hidden.

Some surrogates

(

e.g. polynomial response surfaces) cater mostly to noisy data.

Some

(e.g.

Kriging

)

interpolate data. Slide6

Surrogates of given functional form

Noisy response Linear approximationRational approximationData from ny experimentsError (fit) metricsSlide7

Linear Regression

Functional formFor linear approximationError or difference between data and surrogateRms errorMinimize

rms

error

e

T

e=(y-XbT)T(y-X

bT)Differentiate to obtain

Beware of ill-conditioning

!Slide8

Example

Data: y(0)=0, y(1)=1, y(2)=0Fit linear polynomial y=b0+b1xThen

Obtain

b

0

=1/3,

b1=0,

.Surrogate preserves the average value of the data at data points.

 Slide9

Other metric fits

Assuming other fits will lead to the form ,For average error minimize

Obtain b=0.

For maximal error minimize

obtain b=0.5


Rms

fit

Av. Err. fit

Max

err. fit

RMS error

0.471

0.577

0.5

Av

. error

0.444

0.333

0.5

Max

error

0.667

1

0.5Slide10

Three linesSlide11

Original 30-point curve fit

With dense data difference due to metrics is small

.

Rms

fit

Av. Err. fit

Max

err. fit

RMS error

1.278

1.283

1.536

Av

. error

0.958

0.951

1.234

Max

error

3.007

2.987

2.934Slide12

problemsFind other metrics for a fit beside the three discussed in this lecture.

Redo the 30-point example with the surrogate y=bx. Use the same data.

3.

Redo the 30-point example using only every third point (x=3,6,…). You can consider the other 20 points as test points used to check the fit. Compare the difference between the fit and the data points to the difference between the fit and the test points. It is sufficient to do it for one

fit metric.

Source: Smithsonian Institution

Number: 2004-57325