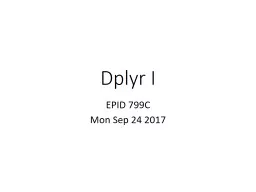
Todays Overview Pipes dplyr verbs filter summarise groupby Windows demos Homework 1 thoughts Homework 2 due Wed Homework 3 coming soon dplyr theory verbs Dplyr bigpicture ID: 692413
Download Presentation The PPT/PDF document "Dplyr I EPID 799C Mon Sep 24 2017" is the property of its rightful owner. Permission is granted to download and print the materials on this web site for personal, non-commercial use only, and to display it on your personal computer provided you do not modify the materials and that you retain all copyright notices contained in the materials. By downloading content from our website, you accept the terms of this agreement.
Slide1
Dplyr I
EPID 799CMon Sep 24 2017Slide2
Today’s Overview
Pipesdplyrverbs: filter summarise
group_by
Windows
demos
Homework 1
: thoughts
Homework 2
: due Wed
Homework 3
: coming soon!Slide3
dplyr
theory, verbsSlide4
Dplyr
big-picture
Standard grammar of data manipulation
: Standard “words” and “phrases.” More abstraction for us humans.
Dataset abstracted
. Base R largely operates on vectors.
Dplyr
is oriented toward operating on data sets all at once. Functions aim at returning datasets.
Smart & efficient.
E.g. use
dplyr
on a database connection, and
dplyr
translates to
sql
for you.Slide5
Dplyr
big-picture
One Table Verbs
filter, select, arrange, summarize, mutate,
group_by
Linking Phrases
Pipe %>% (think “…then…”)
Multi-Table Verbs
mutating & filtering table joins, set operations, binding
Concepts / tidy data
wide & long dataSlide6
Whiteboard Overview
Use the words in a sentence!Slide7
Sidenote
:Star Wars
One of a few datasets included in
tidyr
/
dplyr
http://dplyr.tidyverse.org/reference/starwars.html#examples
Slide8
filter()Slide9
filter()
We have ways to do this []
filter(
starwars
,
homeworld
=="Tatooine")
Almost same as :
starwars
[
starwars$homeworld
== "Tatooine",]Slide10
select()Slide11
select()
select(
starwars
, name, height, mass)Slide12
arrange()
arrange(
starwars
, name)
arrange(
starwars
,
desc
(
homeworld
))Slide13
mutate()
Row-by-row actionsSlide14
mutate()
mutate(
starwars
,
is_tatooine_native
=
homeworld
=="Tatooine")
transmute(
starwars
,
is_tatooine_native
=
homeworld
=="Tatooine")Slide15
mutate()
Window functions
Others (rolling & recycled aggregates) are beyond the scope of this introductionSlide16
summarise()
Many to one operationsSlide17
summarise()
summarise
(
starwars
,
avg_height
= mean(height, na.rm=T),
avg_mass
= mean(mass, na.rm=T))
summarise_at
(
starwars
, c("height", "mass"), mean, na.rm=T)Slide18
group_by()
Groups variables within a
data.frame
* to perform multiple summarizing (or windowed*) actions on.Slide19
group_by()
group_by
(
starwars
,
homeworld
)
summarise_at
(
group_by
(
starwars
,
homeworld
),
c("height", "mass"), mean, na.rm=T)Slide20
Multi-Table OperationsSlide21
Tibble
sidenoteSlide22
Tibbles
A layer built on
data.frames
Largely work the same (if not,
as.data.frame
() it), but support retaining groups, prettier printing, etc.
class(
starwars
)
str
(
starwars
)
Note a slick move with films, vehicles, starships…Slide23
PipesSlide24
The Pipe
What?
Simplest pipe (%>%) takes what’s on the left and makes it the new first argument of what’s on the right
a %>% b(arg1=1, arg2=2)
becomes
b(a, arg1=1, arg2=2)
Slide25
The PipeSlide26
The Pipe
Why?
Easier to chain than nesting or multiple temporary datasets. And we often think or operate in chains, doing something new to the thing we just worked on.
“Take this thing, do this to it, do this other thing, then another, then group that, summarize that, and plot it.”
Helps reorder R constructs to human language.
Dplyr
(with pipes) create a “grammar” of data manipulation, which help translate concepts into “sentences.”Slide27
The Pipe
a1 <-
group_by
(flights, year, month, day)
a2 <- select(a1,
arr_delay
,
dep_delay
)
a3 <-
summarise
(a2,
arr
= mean(
arr_delay
, na.rm = TRUE),
dep = mean(
dep_delay
, na.rm = TRUE))
a4 <- filter(a3,
arr
> 30 | dep > 30)Slide28
The Pipe
filter(
summarise
(
select(
group_by
(flights, year, month, day),
arr_delay
,
dep_delay
),
arr
= mean(
arr_delay
, na.rm = TRUE),
dep = mean(
dep_delay
, na.rm = TRUE)
),
arr
> 30 | dep > 30
)Slide29
The Pipe
flights %>%
group_by
(year, month, day) %>%
select(
arr_delay
,
dep_delay
) %>%
summarise
(
arr
= mean(
arr_delay
, na.rm = TRUE),
dep = mean(
dep_delay
, na.rm = TRUE)
) %>%
filter(
arr
> 30 | dep > 30)Slide30
The Pipe
births$sex
%>%
hist
()
starwars
%>% filter(mass > 100)
starwars
%>%
filter(films %in% "Revenge of the
Sith
")
# How new sf in GIS works....Slide31
The Pipe
planet_bmi
=
starwars
%>%
group_by
(
homeworld
) %>%
summarise_at
(c("height", "mass"), mean, na.rm=T) %>%
mutate(
bmi
= mass / (height/100)^2)Slide32
The Pipe
More complex piping here:
https://cran.r-project.org/web/packages/magrittr/vignettes/magrittr.html
Slide33
Tidy Data
wide? long?Slide34
tidyrSlide35
tidyrSlide36
tidyr
Most common:
gather() spread()
Less common:
separate() unite()Slide37
a =
starwars
%>%
gather("
num
", "
val
", height, mass,
birth_year
)
b = a %>%
spread(
num
,
val
)Slide38
Advanced Concepts
Things we’re not covering, but you should know exist
http://dplyr.tidyverse.org/reference/index.html
Slide39
Working with Databases
Package
dbplyr
Translates your
dplyr
into SQL code to send to a connection
Try it out if you have access to a server!
https://github.com/tidyverse/dbplyr
https://github.com/tidyverse/dbplyr/blob/master/vignettes/dbplyr.Rmd
Slide40
Non-Standard Evaluation
It’s why not quoting things works
It gets really hairy
Use case:
What if you want to “program” with
dplyr
?Slide41
Integration w/ other packages
%>% passes objects (often data) around into first argument.
What have we seen recently that starts with data?Slide42
What does this do?
#
Instaggplot
starwars
%>%
group_by
(
homeworld
) %>%
summarise_at
(c("height", "mass"), mean, na.rm=T) %>%
mutate(
bmi
= mass / (height/100)^2) %>%
ggplot
(
aes
(
homeworld
,
bmi
, fill=
homeworld
)) +
geom_col
(
show.legend
= F)+
coord_flip
()Slide43
Putting it all together
Back to birthsSlide44
Let’s Try
What is the mean and sd
weeks of gestation by race-ethnicity group?
Construct a
dplyr
“sentence” to look at county-specific effects on preterm and pnc5. (HW3!)Slide45
Answers
births %>%
left_join
(
data.frame
(
mrace
=1:4,
race_f
=c("W", "B", "AI/AN", "O"))) %>%
group_by
(
race_f
,
methnic
) %>%
summarise
(
avg_gest
= mean(
wksgest
, na.rm = T),
gest_sd
=
sd
(
wksgest
, na.rm=T),
n=n()) %>%
mutate(
ci_low
= avg_gest-0.5*1.96*
gest_sd
,
ci_high
= avg_gest+0.5*1.96*
gest_sd
) %>%
arrange(
avg_gest
) %>%
filter(
methnic
!= "U" &
race_f
!= "O") %>%
unite(
raceeth
,
race_f
,
methnic
,
sep
=".") %>%
ggplot
(
aes
(
raceeth
,
avg_gest
, fill=
avg_gest
))+
geom_col
()+
geom_linerange
(
aes
(x=
raceeth
,
ymin
=
ci_low
,
ymax
=
ci_high
), color="grey")+
geom_text
(
aes
(label=round(
avg_gest
, 1)),
nudge_y
= 1)
#Q2: See you on Wednesday! Homework 3!