/
Integrating plant-microbe interactions to understand soil C Integrating plant-microbe interactions to understand soil C

Integrating plant-microbe interactions to understand soil C - PowerPoint Presentation

sherrill-nordquist
sherrill-nordquist . @sherrill-nordquist
Follow
402 views
Uploaded On 2016-11-20

Integrating plant-microbe interactions to understand soil C - PPT Presentation

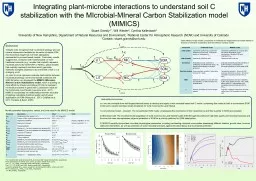
Background Despite wide recognition that microbial physiology and soil mineral interactions facilitate the formation of stable SOM this theoretical insight has not been adequately represented in process based models Preliminary results suggest that compared with models based on more traditio ID: 490928

soil microbial litter model microbial soil model litter som mimics pool entering physical amp protection mic inputs micr turnover

Share:

Link:

Embed:

Download Presentation from below link

Download Presentation The PPT/PDF document "Integrating plant-microbe interactions t..." is the property of its rightful owner. Permission is granted to download and print the materials on this web site for personal, non-commercial use only, and to display it on your personal computer provided you do not modify the materials and that you retain all copyright notices contained in the materials. By downloading content from our website, you accept the terms of this agreement.


Presentation Transcript

Slide1

Integrating plant-microbe interactions to understand soil C stabilization with the MIcrobial-MIneral Carbon Stabilization model (MIMICS)

BackgroundDespite wide recognition that microbial physiology and soil mineral interactions facilitate the formation of stable SOM, this theoretical insight has not been adequately represented in process based models. Preliminary results suggest that, compared with models based on more traditional concepts (e.g., models that implicitly represent microbial activity like CENTURY or RothC), global models that explicitly represent microbial activity generate markedly divergent projections about the fate of soil C in a changing world.In order to more rigorously evaluate relationships between microbial physiology, soil environmental conditions and SOM formation we developed the MIMICS (MIcrobial-Mineral Carbon Stabilization) model, which is building on initial efforts by Wieder and others (2013) to represent microbial processes in global soil C predictions made by the Community Land Model. MIMICS incorporates the relationships between microbial physiology, substrate chemical quality, and physical stabilization of SOM.

Stuart Grandy

1*, Will Wieder2, Cynthia Kallenbach1

1

University of New Hampshire, Department of Natural Resources and Environment; 2National Center for Atmospheric Research (NCAR) and University of Colorado*Contact: stuart.grandy@unh.edu

Parameter

Description

Value

UnitsfmetPartitioning of litter inputs to LITm 0.85 - 0.013(lignin/N) – fiFraction of litter inputs directly transferred to SOM0.02, 0.3×e(-4×fmet) § –VslopeRegression coefficient0.063 #ln(mg Cs (mg MIC)-1 h-1)°C-1VintRegression intercept5.47 #ln(mg Cs (mg MIC)-1 h-1)aVTuning coefficient8 ×10-6 # –Vmod-rModifies Vmax for each substrate pool entering MICr10, 2, 6, 2 * –Vmod-KModifies Vmax for each substrate pool entering MICK2, 2, 2, 2 ¶ –KslopeRegression coefficient0.017 §§ ln(mg C cm-3)°C-1KintRegression intercept3.19 #ln(mg C cm-3)aKTuning coefficient10 # –Kmod-rModifies Km for each substrate pool entering MICr0.125, 0.5, Pscalar, Cscalar * –Kmod-KModifies Km for each substrate pool entering MICK0.5, 0.25, Pscalar, Cscalar ¶ –PscalarPhysical protection scalar used in Kmod 1 / (2.5×e(-3×fclay)) –  CscalarChemical protection scalar using in Kmod1 / (1.4 + 0.2(fclay)) –MGEMicrobial growth efficiency for substrate pools0.6, 0.6, 0.3, 0.3 ##mg mg-1tMicrobial biomass turnover rate 6×10⁻⁴×e(0.9×fmet), 3×10⁻⁴ **h-1  fcFraction of t partitioned to SOMc 0.2×e(-2×fmet), 0.4×e(-3×fmet) ** – 

Model parameter descriptions, values, and units used in MIMICS. .

LITm, LITs: metabolic and structural litter. MICr, MICk: r vs k selected microbial communities. SOMp, SOMa, SOMc: physically protected, active, and chemically protected soil C pools§For metabolic litter inputs entering SOMp & structural litter inputs entering SOMc, respectively#From observations in German et al. (2012), as used in Wieder et al. (2013).*For LITm, LITs, SOMp, and SOMc fluxes entering MICr, respectively.¶For LITm, LITs, SOMp, and SOMc, fluxes entering MICK, respectively.§§ Used to calculate all Km values, except for LITs entering MICr & MICK, which used 0.027 ##For C leaving LITm, SOMp, LITs & SOMc, respectively.**For MICr & MICK, respectivelyFor additional model details see Wieder et al. Biogeosciences Discussions, 11:1147-1185

ComponentTraditional modelMIMICS modelLitter qualityDetermines partitioning to pools with different turnover times. SOM pools decline w/ increasing fmet Determines partitioning to LIT pools and the relative abundance of MIC communities. Variable SOM pool response to fmet. Litter quantityDetermines SOM pool size.Determines MIC pool size.Soil textureModulates turnover constants & partitioning of SOM between pools. No explicit representation of physical protection. Explicitly represents physical protection of SOM. Provides a mechanism for microbial byproducts to build stable SOM. Reaction kineticsEnvironmentally sensitive. Determines turnover of C pools.Temperature sensitive. Along with MIC pool size determines turnover. Structures competitive dynamics between MICr & MICK.MGEDetermines fraction of C lost between pool transfers, no effect on rates of C mineralization.Determines fraction of C lost in transfers to MIC pools & MIC pool size. Thus, MGE affects rates of C mineralization and competitive dynamics between MICr & MICK.tImplicitly simulated as part of reaction kinetics.Explicitly simulated. Determines microbial control over SOM formation in mineral soils

Major model components in traditional soil biogeochemical models based on theories of chemical recalcitrance and the MIMICS microbial model.

Model validation and comparison

Concepts

from

soil biogeochemical theory

were used to develop and apply a new microbial-based soil C model, comparing this model to both a conventional SOM model and a recent microbial model developed for CLM (Community Land Model). 1) Conventional model – Daycent. Emphasizes litter recalcitrance and litter quantity in SOM accumulation.2) Microbial CLM. The microbial model adaptation of CLM (Community Land Model) builds SOM through links between high litter quality and microbial biomass and turnover but deemphasizes physical protection.3) MIMICS explicitly incorporates microbial physiological parameters, including contrasting microbial communities possessing different kinetics, growth rates, turnover rates and chemistries, as well as protection of some microbial products against microbial decay due to physical protection.

MIMICS predicts litter decomposition

A

B

C

A,B. MIMICS predicts that additions of high quality litter (low C/N and lignin/N

ratioa

) will increase soil C in clay soil. This increase is driven by an increase in MICr and the physical stabilization of microbial residues in clay soils. By contrast, in sandy soils, C is primarily stabilized by chemical recalcitrance, and higher C is associated with low quality inputs. C. An increase in litter inputs increases soil C in Daycent in both clay and sand dominated soils. In MIMICS, there’s a sharp increase in clay soils due to physical protection of microbial biomass, but in sandy soils priming mechanisms limit C increases. In the microbial CLM model priming limits soil C increases. MIMICS represents a hybrid model. It incorporates physical stabilization mechanisms as well as microbial community feedbacks.

Soil C response to litter quality across soil types in MIMICS

Soil C response by soil type to an increase in litter quality in MIMICS

Soil C response to an increase in litter inputs in a conventional and microbial model and MIMICS