/
EMC Evaluation at Green Bank: EMC Evaluation at Green Bank:

EMC Evaluation at Green Bank: - PowerPoint Presentation

singh
singh . @singh
Follow
65 views
Uploaded On 2023-11-11

EMC Evaluation at Green Bank: - PPT Presentation

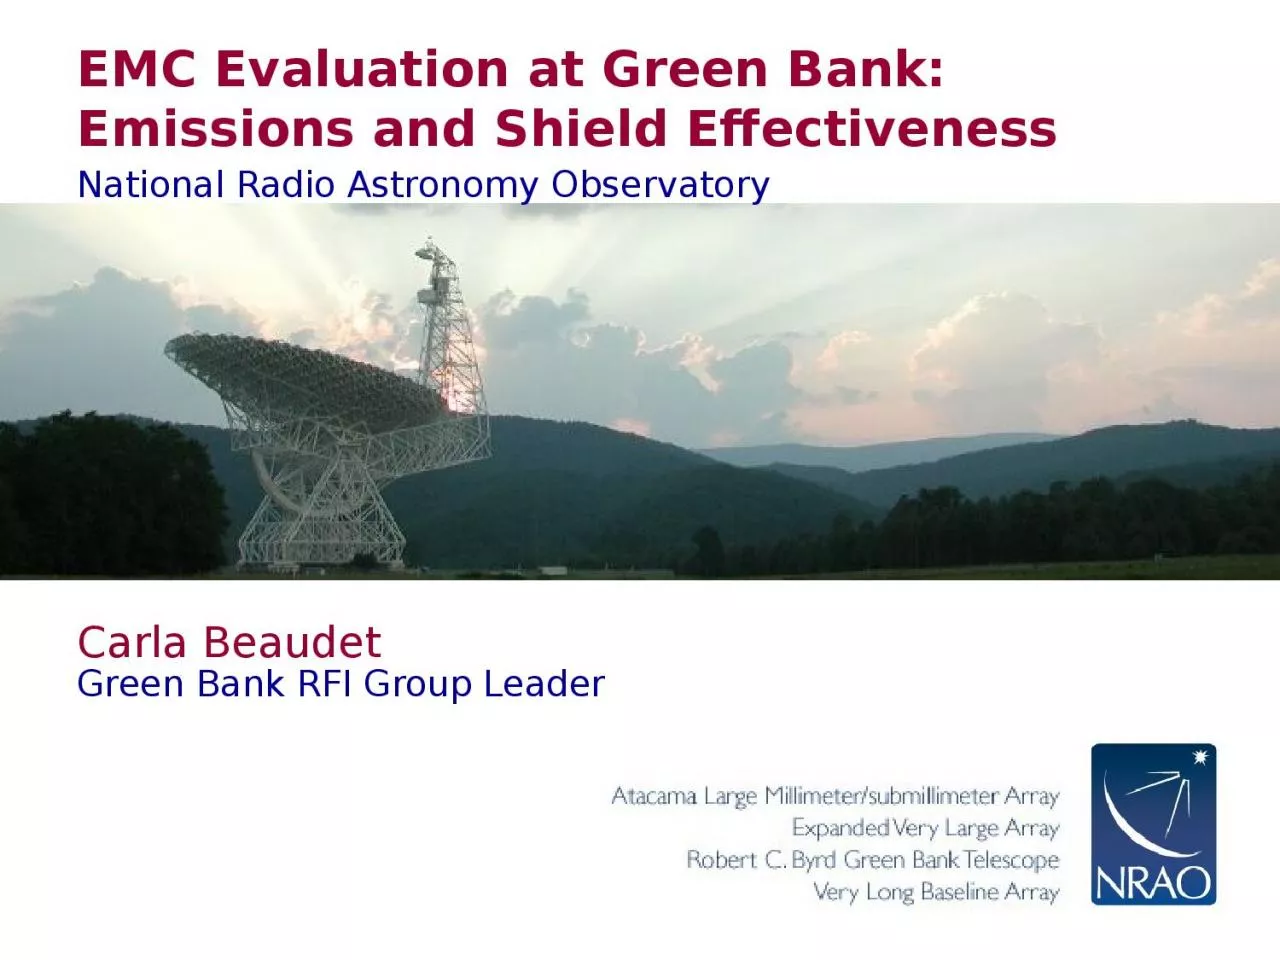
Emissions and Shield Effectiveness National Radio Astronomy Observatory Carla Beaudet Green Bank RFI Group Leader ITUR RA769 specifies typical power flux density PFD threshold of detectabilty for RA receivers ID: 1031103

dbw bandwidth target test bandwidth dbw test target line unit field power strength calculated continuum gbt measured spectral distance

Share:

Link:

Embed:

Download Presentation from below link

Download Presentation The PPT/PDF document "EMC Evaluation at Green Bank:" is the property of its rightful owner. Permission is granted to download and print the materials on this web site for personal, non-commercial use only, and to display it on your personal computer provided you do not modify the materials and that you retain all copyright notices contained in the materials. By downloading content from our website, you accept the terms of this agreement.


Presentation Transcript

1. EMC Evaluation at Green Bank: Emissions and Shield EffectivenessNational Radio Astronomy ObservatoryCarla BeaudetGreen Bank RFI Group Leader

2. ITU-R RA.769 specifies (typical) power flux density (PFD) threshold of detectabilty for RA receivers. Does NOT translate to Radiated Power of Device without specifying a distanceFCC Class B ≈ CISPR 22 specifies allowable field strength at a given distance. Translates to Radiated Power of Device Emissions Evaluation: Standards2

3. Options for not creating self-interference:500km! radius electronic device-free zone!!!!Contain ALL electronic equipment on site with large enclosures, or position facilities behind natural obstacles.Use a practical (compromise) approach, but set policy and adhere to it!3Options for not creating self-interference:500km! radius electronic device-free zone!!!!Contain ALL electronic equipment on site with large enclosures, or position facilities behind natural obstacles.Use a practical (compromise) approach, but set policy and adhere to it!Emissions Evaluation: Practical Limitations and Policy

4. Emissions Evaluation: Practical Limitations and Policy 4Zone 1Policy:No transmitters except 43MHz site radios.All Installed Electronics must comply with ITU-R RA.769 No electronic toys; use of electronics must be work-related. (~50K visitors/year)Zone 2 Policy:No transmitters! (except site radios)Electronics that will be mitigated to comply with ITU-R RA.769 include:Anything that cannot be easily powered offAnything that radiates in excess of FCC part 15 class B levels.

5. Emissions Evaluation: Assessing Equipment for Compliance with ITU-R RA.769 5Equipment Under Test (EUT)Distance (Dtest)Receive (Rx) AntennaCable #1AmplifierCable #2Cable #3Spectrum AnalyzerPowerTx(dBm) = Pmeasured(dBm) + Lspace(dB) – Gantenna(dB) – Gamplifier(dB) + Lcables(dB)Spectrum Analyzer Setup and Measurement Results…     Observed RFI Feature1234 Measured Frequency ( MHz )210.13270.92154.83924.98 Corresponding Wavelength ( meters )1.431.111.940.32 Measured Peak Power ( dBm )-64.00-71.00-66.50-67.20 Spectrum Analyzer Resolution Bandwidth ( MHz )0.0100.0100.0100.010 Measured Half-Power Bandwidth ( MHz )0.01000.01000.01000.0100 Signal CharacteristicsCWCWCWCW Measured Power Per Unit Resolution Bandwidth ( dBW/Hz )-134.00-141.00-136.50-137.20Test Setup and Total Radiated Power Per Unit RBW Measured During Test…     Test Antenna Number ( Select 1, 2, 3, or 4 from Equipment Table )2222 Test Amplifier Number ( Select 1 through 7 from Equipment Table )3333 Test Antenna Gain ( dBi )3.733.732.006.06 Equivalent Test Antenna Collecting Area ( m*m )0.380.230.470.03 Total Transmission Line Loss ( dB ) (modify if different cables used)1.101.100.804.70 Preamplifier Gain ( dB )53.3053.3053.3053.30 Distance From DUT to Test Antenna ( meters )7.007.007.007.00 Calculated Test Setup Space Loss ( dB )32.0634.2731.1442.61 Total Radiated Power Per Unit RBW Measured During Test ( dBW/Hz )-154.14-158.93-157.86-143.19Predicted Field Strength at Target Distance…     Anticipated Distance to GBT ( meters )11111111 Calculated Field Strength at Target Distance ( dBW/m*m/Hz )-185.96-190.75-189.68-175.01 Predicted Impact on GBT Observations…     Predictions for CONTINUUM OBSERVATIONS Corresponding Target GBT CONTINUUM Bandwidth ( MHz )3.003.001.0020.00 Corresponding Target GBT CONTINUUM Limit ( dBW/m*m/Hz )-244.50-244.50-241.00-248.80 Calculated Field Strength Per Unit CONTINUUM Bandwidth ( dBW/m*m/Hz ) -210.73-215.52-209.68-208.02 Calculated Field Strength Per Unit CONTINUUM Bandwidth ( Jy ) 8.46E+042.81E+041.08E+051.58E+05 Feature Exceeds Target CONTINUUM Limit By… ( dBW/m*m/Hz )33.7728.9831.3238.78  Predictions for SPECTRAL LINE OBSERVATIONS Corresponding Target GBT SPECTRAL LINE Bandwidth ( MHz )2.002.001.008.00 Corresponding Target GBT SPECTRAL LINE Limit ( dBW/m*m/Hz )-241.40-241.40-238.80-241.60 Calculated Field Strength Per Unit SPECTRAL LINE Bandwidth ( dBW/m*m/Hz ) -208.97-213.76-209.68-204.04 Calculated Field Strength Per Unit SPECTRAL LINE Bandwidth ( Jy ) 1.27E+054.21E+041.08E+053.94E+05 Feature Exceeds Target SPECTRAL LINE Limit By… ( dBW/m*m/Hz )32.4327.6429.1237.56

6. Emissions Evaluation: Assessing Equipment for Compliance with ITU-R RA.769 6Faraday CagesLow-Pass FiltersRF Absorber

7. Emissions Evaluation: Assessing Equipment for Compliance with ITU-R RA.769 7Equipment Under Test (EUT)Distance (Dtest)Receive (Rx) AntennaCable #1AmplifierCable #2Cable #3Spectrum AnalyzerPowerTx(dBm) = Pmeasured(dBm) + Lspace(dB) – Gantenna(dB) – Gamplifier(dB) + Lcables(dB)Spectrum Analyzer Setup and Measurement Results…     Observed RFI Feature1234 Measured Frequency ( MHz )210.13270.92154.83924.98 Corresponding Wavelength ( meters )1.431.111.940.32 Measured Peak Power ( dBm )-64.00-71.00-66.50-67.20 Spectrum Analyzer Resolution Bandwidth ( MHz )0.0100.0100.0100.010 Measured Half-Power Bandwidth ( MHz )0.01000.01000.01000.0100 Signal CharacteristicsCWCWCWCW Measured Power Per Unit Resolution Bandwidth ( dBW/Hz )-134.00-141.00-136.50-137.20Test Setup and Total Radiated Power Per Unit RBW Measured During Test…     Test Antenna Number ( Select 1, 2, 3, or 4 from Equipment Table )2222 Test Amplifier Number ( Select 1 through 7 from Equipment Table )3333 Test Antenna Gain ( dBi )3.733.732.006.06 Equivalent Test Antenna Collecting Area ( m*m )0.380.230.470.03 Total Transmission Line Loss ( dB ) (modify if different cables used)1.101.100.804.70 Preamplifier Gain ( dB )53.3053.3053.3053.30 Distance From DUT to Test Antenna ( meters )7.007.007.007.00 Calculated Test Setup Space Loss ( dB )32.0634.2731.1442.61 Total Radiated Power Per Unit RBW Measured During Test ( dBW/Hz )-154.14-158.93-157.86-143.19Predicted Field Strength at Target Distance…     Anticipated Distance to GBT ( meters )11111111 Calculated Field Strength at Target Distance ( dBW/m*m/Hz )-185.96-190.75-189.68-175.01 Predicted Impact on GBT Observations…     Predictions for CONTINUUM OBSERVATIONS Corresponding Target GBT CONTINUUM Bandwidth ( MHz )3.003.001.0020.00 Corresponding Target GBT CONTINUUM Limit ( dBW/m*m/Hz )-244.50-244.50-241.00-248.80 Calculated Field Strength Per Unit CONTINUUM Bandwidth ( dBW/m*m/Hz ) -210.73-215.52-209.68-208.02 Calculated Field Strength Per Unit CONTINUUM Bandwidth ( Jy ) 8.46E+042.81E+041.08E+051.58E+05 Feature Exceeds Target CONTINUUM Limit By… ( dBW/m*m/Hz )33.7728.9831.3238.78  Predictions for SPECTRAL LINE OBSERVATIONS Corresponding Target GBT SPECTRAL LINE Bandwidth ( MHz )2.002.001.008.00 Corresponding Target GBT SPECTRAL LINE Limit ( dBW/m*m/Hz )-241.40-241.40-238.80-241.60 Calculated Field Strength Per Unit SPECTRAL LINE Bandwidth ( dBW/m*m/Hz ) -208.97-213.76-209.68-204.04 Calculated Field Strength Per Unit SPECTRAL LINE Bandwidth ( Jy ) 1.27E+054.21E+041.08E+053.94E+05 Feature Exceeds Target SPECTRAL LINE Limit By… ( dBW/m*m/Hz )32.4327.6429.1237.56

8. Shield Effectiveness Evaluation8

9. Shield Effectiveness Evaluation9

10. Shield Effectiveness Measurement Standard10

11. Highlights of the Test Procedure:Obtain Reference Measurements at distance D.Receiver set to MAX HOLD while moving Rx antenna in a plane parallel to enclosure surface at distance D. Many Measurement locations for most reliable results and to identify problem areas. Shield Effectiveness Evaluation11

12. 12Thank You!