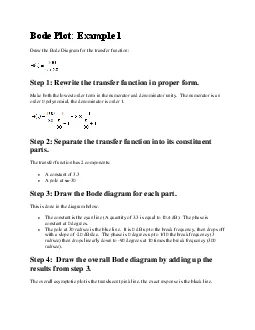
Draw the Bode Diagram for the transfer functionStep 1 Rewrite the transfer function in proper formMake both the lowest order term in the numerator and denominator unityThe numerator is an order 0 poly ID: 870351
Download The PPT/PDF document "Bode Plot Example 1" is the property of its rightful owner. Permission is granted to download and print the materials on this web site for personal, non-commercial use only, and to display it on your personal computer provided you do not modify the materials and that you retain all copyright notices contained in the materials. By downloading content from our website, you accept the terms of this agreement.