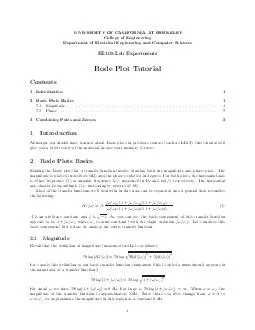
/
UNIVERSITY OF CALIFORNIA AT BERKELEY College of Engineering Department of Electrical Engineering UNIVERSITY OF CALIFORNIA AT BERKELEY College of Engineering Department of Electrical Engineering

UNIVERSITY OF CALIFORNIA AT BERKELEY College of Engineering Department of Electrical Engineering - PDF document

tawny-fly
tawny-fly . @tawny-fly
Follow
657 views
Uploaded On 2014-12-12

UNIVERSITY OF CALIFORNIA AT BERKELEY College of Engineering Department of Electrical Engineering - PPT Presentation

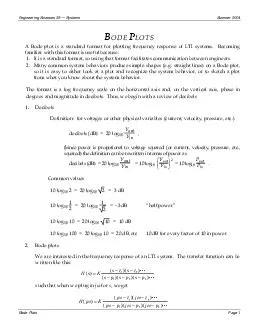
1 Magnitude 1 22 Phase 2 3 Combining Poles and Zeroes 1 Introduction Although you should have learned about Bode plots in previou s courses such as EE40 t ID: 22584

Magnitude

Share:

Link:

Embed:


Presentation Transcript

UNIVERSITYOFCALIFORNIAATBERKELEYCollegeofEngineeringDepartmentofElectricalEngineeringandComputerSciencesEE105LabExperimentsBodePlotTutorialContents1Introduction12BodePlotsBasics12.1Magnitude...............................................12.2Phase.................................................23CombiningPolesandZeroes31IntroductionAlthoughyoushouldhavelearnedaboutBodeplotsinpreviouscourses(suchasEE40),thistutorialwillgiveyouabriefreviewofthematerialincaseyourmemoryisrusty.2BodePlotsBasicsMakingtheBodeplotsforatransferfunctioninvolvedrawingboththemagnitudeandphaseplots.Themagnitudeisplottedindecibels(dB)andthephaseisplottedindegrees.Forbothplots,thehorizontalaxisiseitherfrequency(f)orangularfrequency(!),measuredinHzandrad=s,respectively.Thehorizontalaxisshouldbelogarithmic(i.e.increasingbypowersof10).Mostofthetransferfunctionswe'lldealwithinthisclasscanbeseparatedintoageneralthatresemblesthefollowing:H(j!)=Aj!=!z1(1+j!=!z2)(1+j!=!z3)::: j!=!p1(1+j!=!p2)(1+j!=!p3):::(1)Aisanarbitraryconstantandjisp 1.Asyoucansee,thebasiccomponentofthistransferfunctionappearstobe1+j!=!c,where!cissomeconstant(withtheslightvariationj!=!c).Let'sanalyzethisbasiccomponent rstbeforeweanalyzetheentiretransferfunction.2.1MagnitudeRecallthatthede nitionofmagnitude(measuredindB)isasfollows:20logjH(j!)j=20logq [H(j!)]2+=[H(j!)]2Let'sapplythisde nitiontoourbasictransferfunctioncomponent(thisiscalledazerowhenitappearsinthenumeratorofatransferfunction):20logj1+j!=!cj=20logq 1+(!=!c)2Forsmall!,wehave20logj1+j!=!cj0dB.Forlarge!,20logj1+j!=!cj!1.When!=!c,themagnitudeofthetransferfunctionisapproximately3dB.Sincethere'ssolittlechangefrom!=0to!=!c,weapproximatethemagnitudeinthisregionasaconstant0dB.1 2BODEPLOTSBASICS2For!�!c,the(!=!c)2dominatesthemagnitudeexpression,allowingustoapproximatethemagnitudeas20log!=!c.Fromthisexpressionit'sclearthatifweincrease!byafactorof10,weincreasethemagnitudeby20dB.Thus,ourBodeplotapproximationforthezeroisaconstant0dBfor!!candalineconstantlyincreaseby20dB=decadefor!&#x-318;&#x.308;!c,illustratedinFigure1.Figure1alsoillustratestheBodeplotforaDCzerooftheformj!=!c.Thisdi ersonlyslightlyfromthenormalzerointhatislackstheadditional1.Thus,insteadofhavingtheconstantmagnituderegionfor!!c,issimplyalwaysincreasesat20dB=decade.Wedrawitsintersectionwiththefrequencyaxiswhere!=!c,sincethat'swherethemagnitudeis0dB. 402002040Magnitude(dB)103104105106107!(rad/s) 20logj1+j!=!cj 20logjj!=!cj Figure1:Bodeplots(magnitude)foranormalzeroandaDCzerofor!c=105rad=s(theplotsoverlapfor!�!c)Thebasictransferfunctioncomponent1+j!=!ccanalsoappearinthedenominator(inwhichcaseitiscalledapole).Althoughthismayseemlikeanentirelydi erentproblem,recallthatwetakethelogarithmofourtransferfunctionbecauseourresultisexpressedindecibels.Takingthelogarithmoftheinverseofafunctionsimplygivesthenegativelogarithmofthefunction,meaningwesimplyhavetonegatetheresultsofourzeroanalysistogettheappropriateexpressionsforpoles.ThesameargumentapplieswithDCpolesoftheformj!=!c,sowecannegateourDCzeroanalysistogettheDCpoleresults.Anormalpolewillhaveaconstant0dBvaluefor!!candwilldropby20dB=decadefor!&#x-282;&#x.199;!c.ADCpolewilldropby20dB=decadeforany!andwillintersectthefrequencyaxis(0dB)at!=!c.TheresultsareshowninFigure2.2.2PhaseLet'stakealookatthephaseofazero,DCzero,pole,andDCpole.Recallthede nitionofphase:Arg(H(j!))=tan1[H(j!)] =[H(j!)] 3COMBININGPOLESANDZEROES3 402002040Magnitude(dB)103104105106107!(rad/s) 20log 1 1+j!=!c 20log 1 j!=!c Figure2:Bodeplots(magnitude)foranormalpoleandaDCpolefor!c=105rad=s(theplotsoverlapfor!�!c)Let'sapplythistothenormalzero rst.Arg(1+j!=!c)=tan1! !cFor!=0,Arg(1+j!=!c)=0.For!!1,Arg(1+j!=!c)!90.For!=!c,Arg(1+j!=!c)!45.Thus,ourapproximationforthephaseofazerois0for!0:1!c,45for!=!c,and90for!&#x-5.1;䡣10!cwithastraightlineconnectingthesepoints.WecanalsolookatthephaseofaDCzero,whichisalways90.TheseresultsareshowninFigure3.Similartoouranalysisofthemagnitude,wecanalsoconsiderpolesandDCpolesinourphaseplots.Itcanbeshownthattan1=tan1,meaningourphaseplotsforpolesandDCpoleswillsimplybenegatedversionsofthezeroplots.TheseareshowninFigure4.3CombiningPolesandZeroesGenerally,atransferfunctionmayinvolvemanypolesandzeroes(andtheirDCcounterparts).InordertomakeiteasiertodrawBodeplots,your rststepshouldbetofactorthetransferfunctionintothecanonicalformshowninEquation1.Thismakesiteasytoidentifyallofthepolesandzeroes.First,you'llhavetohandletheconstantAinfront(ifpresent).ThemagnitudeofAwilla ectyourmagnitudeplot,andthesignofAwilla ectyourphaseplot.Yourmagnitudeplotmustbeshiftedupby20logjAj.Forexample,ifA=10,thenyourmagnitudeplotmustbeshiftedupby20dB.Similarly,ifA=1=10,thenyourmagnitudeplotmustbeshifteddownby20dB.IfA0,thenyourphaseplotmustbeshiftedup(ordown|it'sthesameinthiscase)by180.Second,youneedtodraweachpoleandzeroindividuallyonthesamesetofaxes(whetheryou'remakingamagnitudeorphaseplot). 3COMBININGPOLESANDZEROES4 020406080100Phase(degrees)103104105106107!(rad/s) Arg(1+j!=!c) Arg(j!=!c) Figure3:Bodeplots(phase)foranormalzeroandaDCzerofor!c=105rad=s(theplotsoverlapfor!�10!c)Third,yousimplyaddthecurvesthatyou'vedrawnateachpointtoobtainthe nalBodeplot.RemembertoshiftyourplotsaccordinglybasedontheconstantAasmentionedpreviously.Thissuperpositionprincipleispossiblebecauseofthedecompositionofthetransferfunctionintozeroesandpoles.Whenaddingthepolesandzeroesinthe nalplot,rememberthatinareaswheretwocurvesareconstant,theresultwilljustbethesumoftheconstantvalues.Whenoneisacontantandoneislinear,thentheresultwillstartattheconstantvalueandhavetheslopeofthelinearcurve.Finally,whenbotharelinear,thesumwillhaveaslopeequaltothesumoftheslopesoftheindividalcurves. 3COMBININGPOLESANDZEROES5 100806040200Phase(degrees)103104105106107!(rad/s) Arg1 1+j!=!c Arg1 j!=!c Figure4:Bodeplots(phase)foranormalpoleandaDCpolefor!c=105rad=s(theplotsoverlapfor!�10!c)