PDF-Cross-reference chart/Charte de référence
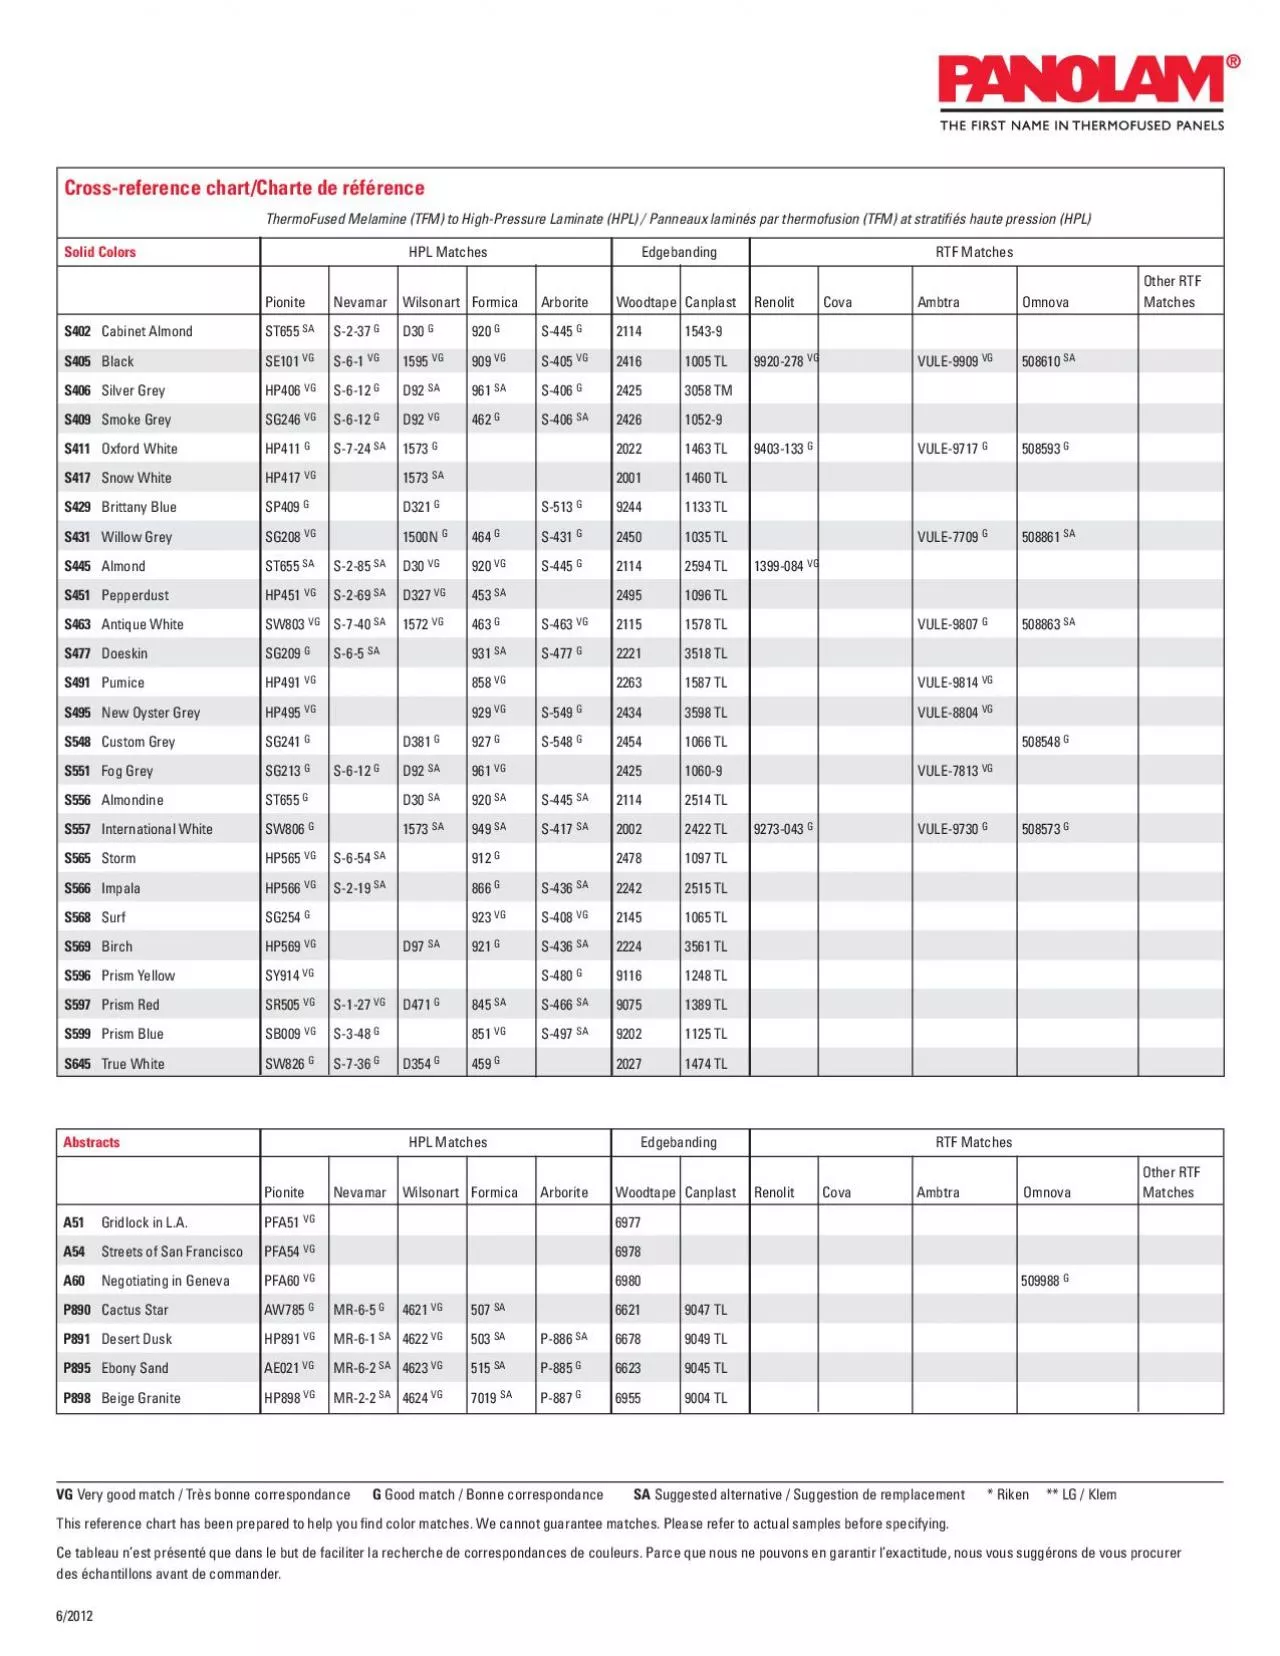
Solid Colors HPL MatchesEdgebanding RTF Matches Other RTF Woodtape
S402 Cabinet AlmondST655 SA
G
D30 G
G
G
S405 BlackSE101 VG
VG
1595 VG 909 VG
VG 24161005 TL9920278
Download Presentation
"Cross-reference chart/Charte de référence" is the property of its rightful owner. Permission is granted to download and print materials on this website for personal, non-commercial use only, provided you retain all copyright notices. By downloading content from our website, you accept the terms of this agreement.
Presentation Transcript
Transcript not available.