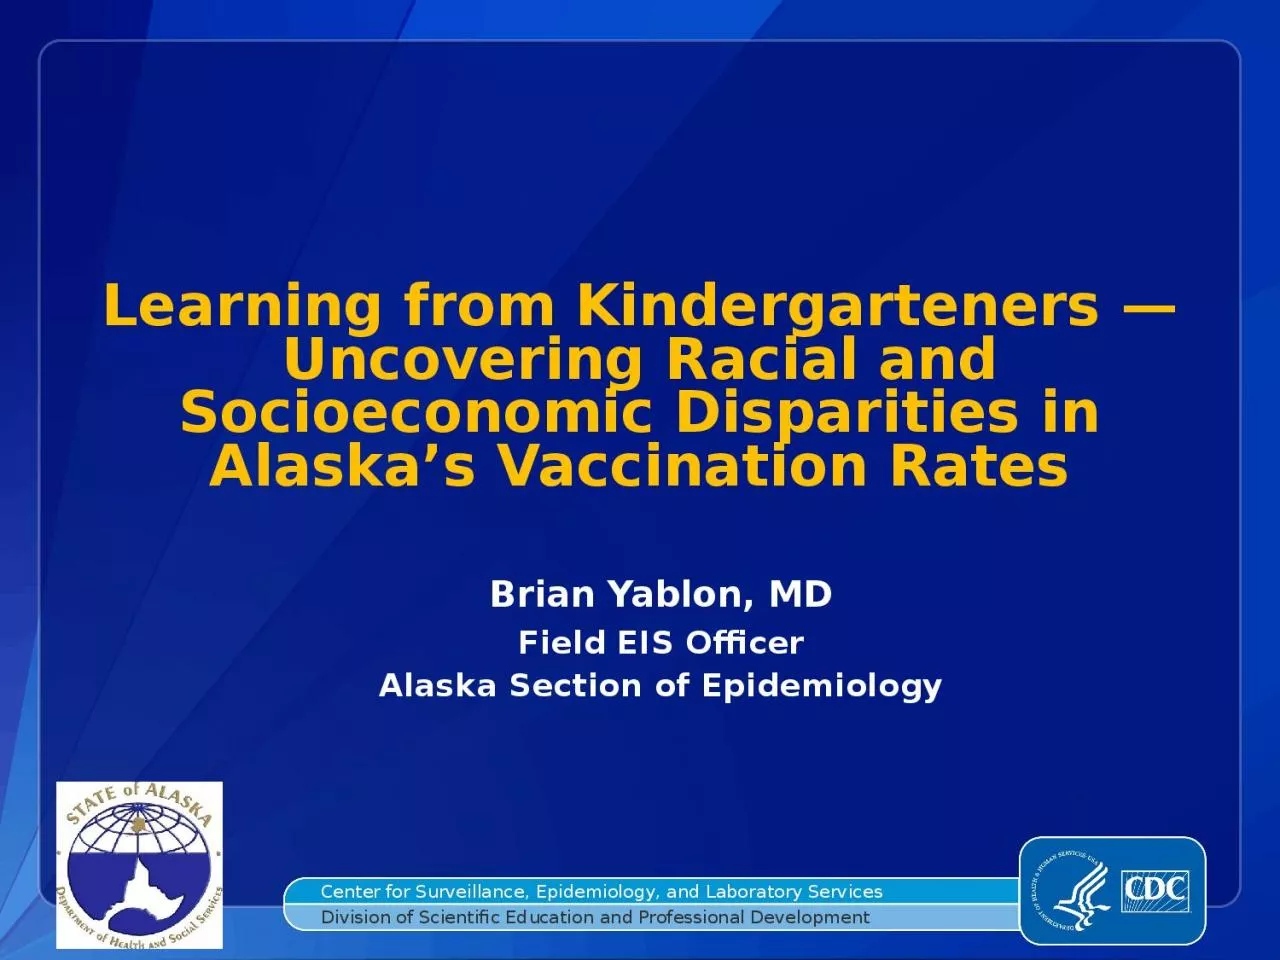
/
Field EIS Officer Alaska Section of Epidemiology Field EIS Officer Alaska Section of Epidemiology

Field EIS Officer Alaska Section of Epidemiology - PowerPoint Presentation

sophia2
sophia2 . @sophia2
Follow
27 views
Uploaded On 2024-02-09

Field EIS Officer Alaska Section of Epidemiology - PPT Presentation

Brian Yablon MD Center for Surveillance Epidemiology and Laboratory Services Division of Scientific Education and Professional Development Learning from Kindergarteners Uncovering Racial and Socioeconomic Disparities in Alaskas Vaccination ID: 1046148

data coverage months dtap coverage data dtap months district disparity mos ses vaccination dose socioeconomic analysis aggregate average race

Share:

Link:

Embed:

Download Presentation from below link

Download Presentation The PPT/PDF document "Field EIS Officer Alaska Section of Epid..." is the property of its rightful owner. Permission is granted to download and print the materials on this web site for personal, non-commercial use only, and to display it on your personal computer provided you do not modify the materials and that you retain all copyright notices contained in the materials. By downloading content from our website, you accept the terms of this agreement.


Presentation Transcript

1. Field EIS OfficerAlaska Section of EpidemiologyBrian Yablon, MDCenter for Surveillance, Epidemiology, and Laboratory ServicesDivision of Scientific Education and Professional DevelopmentLearning from Kindergarteners — Uncovering Racial and Socioeconomic Disparities in Alaska’s Vaccination Rates

2. What is happening with childhood vaccination coverage in Alaska??

3. Background — NIS MethodologyStage 1 — Phone surveyRandom-digit dialing of householdsFormerly landline only; in 2012, 50% cell phoneStage 2 — Provider surveyForm sent to identified provider after parent surveyProvider to fill out vaccination record and mail backData analysisIndividual seriesComposite marker (for 2012 data, 4:3:1:3*:3:1:4)¶Summary report of vaccination coverage for 19–35 month olds in the U.S.¶ ≥ 4 DTaP, ≥ 3 Polio, ≥ 1 MMR, full series Hib (*3 or 4, depending on product), ≥ 3 Hep B, ≥ 1 varicella, and ≥ 4 PCV

4. NIS Limitations and Alaska’s Vaccination CoverageSelection biasPopulation levelProvider levelData interpretationWide confidence intervalsComposite series changesUnder-powered for subgroup analysisRegion of the stateRacial/ethnicSocioeconomic

5. Where is Alaska falling behind?Examine a multiple dose series over time based on NIS data — DTaPDTaP series “on-time” markers1 dose by 3 months2 doses by 5 months3 doses by 7 months4 doses by 19 monthsPattern may suggest factors that most influence coverage rates

6. 34484350424223504938Alaska’s State Rank

7. 50494951485051515145Alaska’s State Rank

8. 45494950475051515151Alaska’s State Rank

9. 35502449475051505151Alaska’s State Rank

10. Bottom line — poor on-time vaccinationThis suggests two potential factorsMissed opportunities (i.e., lack of effective reminder/recall systems)Inadequate access to well child care, vaccines

11. What are known factors associated with being under-vaccinated?*Low SESPaying for immunizationsLack of health insuranceLow parental educationYounger maternal ageLarge family sizeNot remembering vaccination schedules and appointmentsDelayed well child visitsSick child delaysInadequate provider supportLack of available health structuresTransportation and accessibility issues for immunization clinicsLack of knowledge about vaccines and diseasesNegative beliefs/attitudesFear/safety concernsSkepticism/doubts about medical information provided*Falagas ME and Zarkadoulia E, “Factors associated with suboptimal compliance to vaccinations in children in developed countries: a systematic review.” Current Medical Research and Opinion, Vol 24(6):2008

12. Childhood poverty is associated with lower vaccination coverageDocumented in NISMost pronounced for multi-dose seriesNo Alaska-specific socioeconomic coverage data

13. Objectives and MotivationHow do region, race, and socioeconomic status affect vaccination coverage in Alaska?Existing data sources inadequateNIS under-poweredAlaska’s IIS (VacTrAK) lacks race, socioeconomic dataNeed new data source to address this question

14. MethodsRetrospective kindergartener cohortAlaska’s 4 largest school districts2013–2014 school year (children born between September 2007 and August 2008)DTaP selected as marker vaccine seriesData requestedAge at receipt of each vaccinationSchool lunch status (SES proxy)Race/ethnicityVaccine exemption status

15. Data AnalysisAggregateStratified graphical analysis of coverage vs ageDistrictSESRaceLogistic regression of 24-month coverage ratesDistrictRace/ethnicitySESBirth-dose Hep B vaccine receipt (hesitancy proxy)Survival analysis for largest districtTime to 4th DTaP

16. Student CharacteristicsN = 7304 (~70% of state kindergarteners)District A: 1223 studentsDistrict B: 571 studentsDistrict C: 1261 studentsDistrict D: 4249 studentsDemographics will be presented by district

17. Aggregate Coverage by Age Milestone≥ 1 DTaP dose by 3 months: 82%≥ 2 DTaP doses by 5 months: 69%≥ 3 DTaP doses by 7 months: 59%≥ 4 DTaP doses by 19 months: 54%≥ 4 DTaP doses by 24 months: 69%

18. Stratified 24-month coverage by race and SES across districtsAmong AI/AN studentsSES did not significantly affect coverageAmong non-AI/AN studentsHigh-SES had higher coverage than low-SES: 11.9% absolute coverage difference [CI: 9.5–14.3%]Effect independent of school districtAmong low-SES studentsDistrict modified effect of race (p <0.01)2 districts AI/AN students with higher coverage, and 2 districts with no significant difference (graphs follow)Among high-SES studentsRace (AI/AN vs white) did not significantly affect coverage

19. Aggregate Data for District A# of students: 1223% AN/AI: 17%% SL: 38%% AN/AI on SL: 57%% non-AN on SL: 35%% exemptions: 2.3%4 DTaP coverage for 19-35 months: 75%

20. Average Disparity 19-35 mos: 1.7% (not statistically significant)

21. Socioeconomic Disparity in District AAverage Disparity 19-35 mos: 8.1%Average Disparity 7-15 mos: 11.1%

22. Aggregate Data for District B4 DTaP coverage for 19-35 months: 69%# of students: 571% AN/AI: 18%% SL: 41%% AN/AI on SL: 64%% non-AN on SL: 35%% exemptions: ?

23. Average Disparity 19-35 mos: 4.9% (not statistically significant)

24. Socioeconomic Disparity in District BAverage Disparity 19-35 mos: 13.4%Average Disparity 7-15 mos: 18.2%

25. Aggregate Data for District C4 DTaP coverage for 19-35 months: 61%# of students: 1261% AN/AI: 16%% SL: 41%% AN/AI on SL: 60%% non-AN on SL: 38%% any exemption: 12.5% 5% of AN/AI 14% of non-AN

26. Average Disparity 19-35 mos: 12.8%Average Disparity 7-15 mos: 6.8%

27. Socioeconomic Disparity in District CAverage Disparity 19-35 mos: 10.3%Average Disparity 7-15 mos: 13.2%

28. Aggregate Data for District D4 DTaP coverage for 19-35 months: 74%# of students: 4249 40% SL 2.8% any exemptionWhite: 44% 21% SL, 4.2% ExemptMulti-ethnic: 16% 50% SL, 2.8% ExemptAN/AI: 9% 63% SL, 1.4% ExemptBlack: 6% 62% SL, 0.8% ExemptHispanic: 12% 47% SL, 1.8% ExemptAsian: 9% 52% SL, 1.8% ExemptNH/PI: 5% 67% SL, 0.5% Exempt

29. Coverage,19-35 months: 77%

30. Coverage,19-35 months: 76%

31. Coverage,19-35 months: 81%

32. Coverage,19-35 months: 72%

33. Coverage,19-35 months: 76%

34. Coverage,19-35 months: 62%

35. Coverage,19-35 months: 54%

36. Socioeconomic Disparity in District DAverage Disparity 19-35 mos: 11%Average Disparity 7-15 mos: 11%

37. Univariate Logistic Regression — 24 Month DTaP Coverage, All DistrictsCoverage %Univariate Odds DTaP Not UTDLower 95% CIUpper 95% CIp-value(univariate)DistrictDistrict A721.000.861.150.98District B641.471.231.78<0.001District C581.891.652.14<0.001District D72ReferentRaceAI/AN730.820.690.970.02Asian591.511.231.84<0.001Black661.140.891.460.31Hispanic740.780.650.950.01Multi-Ethnic730.820.690.970.02NH/PI522.071.582.72<0.001White69ReferentSESLower SES631.591.431.76<0.001Higher SES73ReferentBirth Dose HBV?No631.691.531.87<0.001Yes74Referent

38. Multivariate Regression — 24 Month DTaP Coverage, All DistrictsCoverage %Multivariate Odds Not UTDLower 95% CIUpper 95% CIp-value(adjusted)DistrictDistrict A721.10.951.270.22District B641.71.392.07<0.001District C581.971.712.28<0.001District D72ReferentRaceAI/AN730.770.650.910.003Asian591.771.432.18<0.001Black661.180.911.530.2Hispanic740.90.741.110.33Multi-Ethnic731.020.851.230.83NH/PI522.351.763.13<0.001White69ReferentSESLower SES631.621.461.81<0.001Higher SES73ReferentBirth Dose HBV?No631.721.551.9<0.001Yes74Referent

39. District D “Survival” Analysis

40. District D “Survival” Analysis

41. District D “Survival” Analysis

42. District D “Survival” Analysis

43. Survival Analysis (unadjusted) — 4th DTaP Coverage District D; n=4181Age (mos) 75% coverage reached*Hazard Ratio Not UTD**Lower 95% CIUpper 95% CIRaceAI/AN22.10.860.760.98Asian41.81.391.241.56Black26.11.171.021.35Hispanic23.91.020.921.14Multi-Ethnic24.51.020.931.12NH/PI>481.631.411.87White23.8ReferentBirth Dose HBVNo301.301.211.39Yes23.7ReferentSES, All StudentsLower SES29.81.291.211.38Higher SES23.1ReferentSES, White StudentsLower SES311.351.21.52Higher SES21.7Referent*Aggregate pool hit 75% at age 24.9 months **Wilcoxon rank-sum

44. Survival Analysis — 4th DTaP Coverage District D (exclude if zero vax by 36 mos; n = 4050)*Aggregate pool hit 75% at age 24.1 months **Wilcoxon rank-sumAge (mos) 75% coverage reached*Hazard Ratio Not UTD**Lower 95% CIUpper 95% CIRaceAI/AN21.90.90.791.02Asian39.91.481.321.65Black25.61.211.051.39Hispanic23.21.080.971.2Multi-Ethnic241.040.941.14NH/PI47.71.661.441.91White21.6ReferentBirth Dose HBVNo24.61.131.051.21Yes23.6ReferentSES, All StudentsLower SES27.71.351.261.44Higher SES21.6ReferentSES, White StudentsLower SES27.71.41.241.57Higher SES20.2Referent

45. Discussion — What do these data illustrate?Alaska has poor on-time DTaP vaccinationVaccination coverage varies by region, race, and socioeconomic statusSignificant racial and SES coverage disparitiesLower coverage among lower-SES childrenLower coverage among NH/PI, Asian, Black childrenAI/AN race buffers SES effectAccess to free medical careAll VFC eligiblePart of a system that actively monitors coverage by region

46. Discussion — What do these data illustrate?The disparities are opposite what one would expect if “hesitancy” were the primary driverExemption rates higher among white studentsLiterature suggests more hesitancy about vaccination among more affluent parentsFocusing on a small subset of “hesitant” parents gives excessive public health weight to this groupLooking at aggregate data is not good enoughAggregate data can mask disparitiesAggregate data do not facilitate targeted interventions based on local evidence

47. LimitationsSchool vaccination data qualityLack of other SES dataRetrospective with several year data lagPost-hoc, exploratory analysis can introduce potential bias

48. Study StrengthsLarge sample sizeUse of school lunch data as SES proxyGraphical analysisInter-agency partnership

49. RecommendationsImprove access to careAssess and remove barriers at every levelMake it as easy as possible to get UTD on vaccinesExpand reminder/recall and outreach effortsOngoing assessment and feedback to providersPromote birth-dose Hepatitis B vaccineTargeted outreach to children high-risk not to be UTD on vaccines (lower SES, minority children)Continue to monitor coverage disparitiesPartner with schools, WIC, local public healthThat which is not measured will not improveOther states should consider similar studies

50. AcknowledgmentsAlaska Section of EpidemiologyLorraine AlfsenLouisa CastrodaleTricia FranklinMisty HallStephanie MassayJoe McLaughlin*Carmen Springer*Geraldine Yett*CDCDiana BensylW. Randolph DaleyByron Robinson*James SingletonNCIRD Site Visit TeamAnchorage, Fairbanks, Kenai Peninsula Borough, and Mat-Su Borough School DistrictsAlaska Native Tribal Health ConsortiumRosalyn SingletonTania SmallenbergAlaska Section of Public Health Nursing (many people)Alaska Section of Women, Children, and Family HealthStephanie Wrightsman-BirchMargaret YoungAlaska EPSDT ProgramCarrie TruettMuni of Anchorage DHHSThe findings and conclusions in this report are those of the authors and do not necessarily represent the official position of the Centers for Disease Control and Prevention.* = Abstract co-author