/
x0000x0000US Energy Information Administration      Levelized Costof N x0000x0000US Energy Information Administration      Levelized Costof N

x0000x0000US Energy Information Administration Levelized Costof N - PDF document

sophie
sophie . @sophie
Follow
345 views
Uploaded On 2021-09-27

x0000x0000US Energy Information Administration Levelized Costof N - PPT Presentation

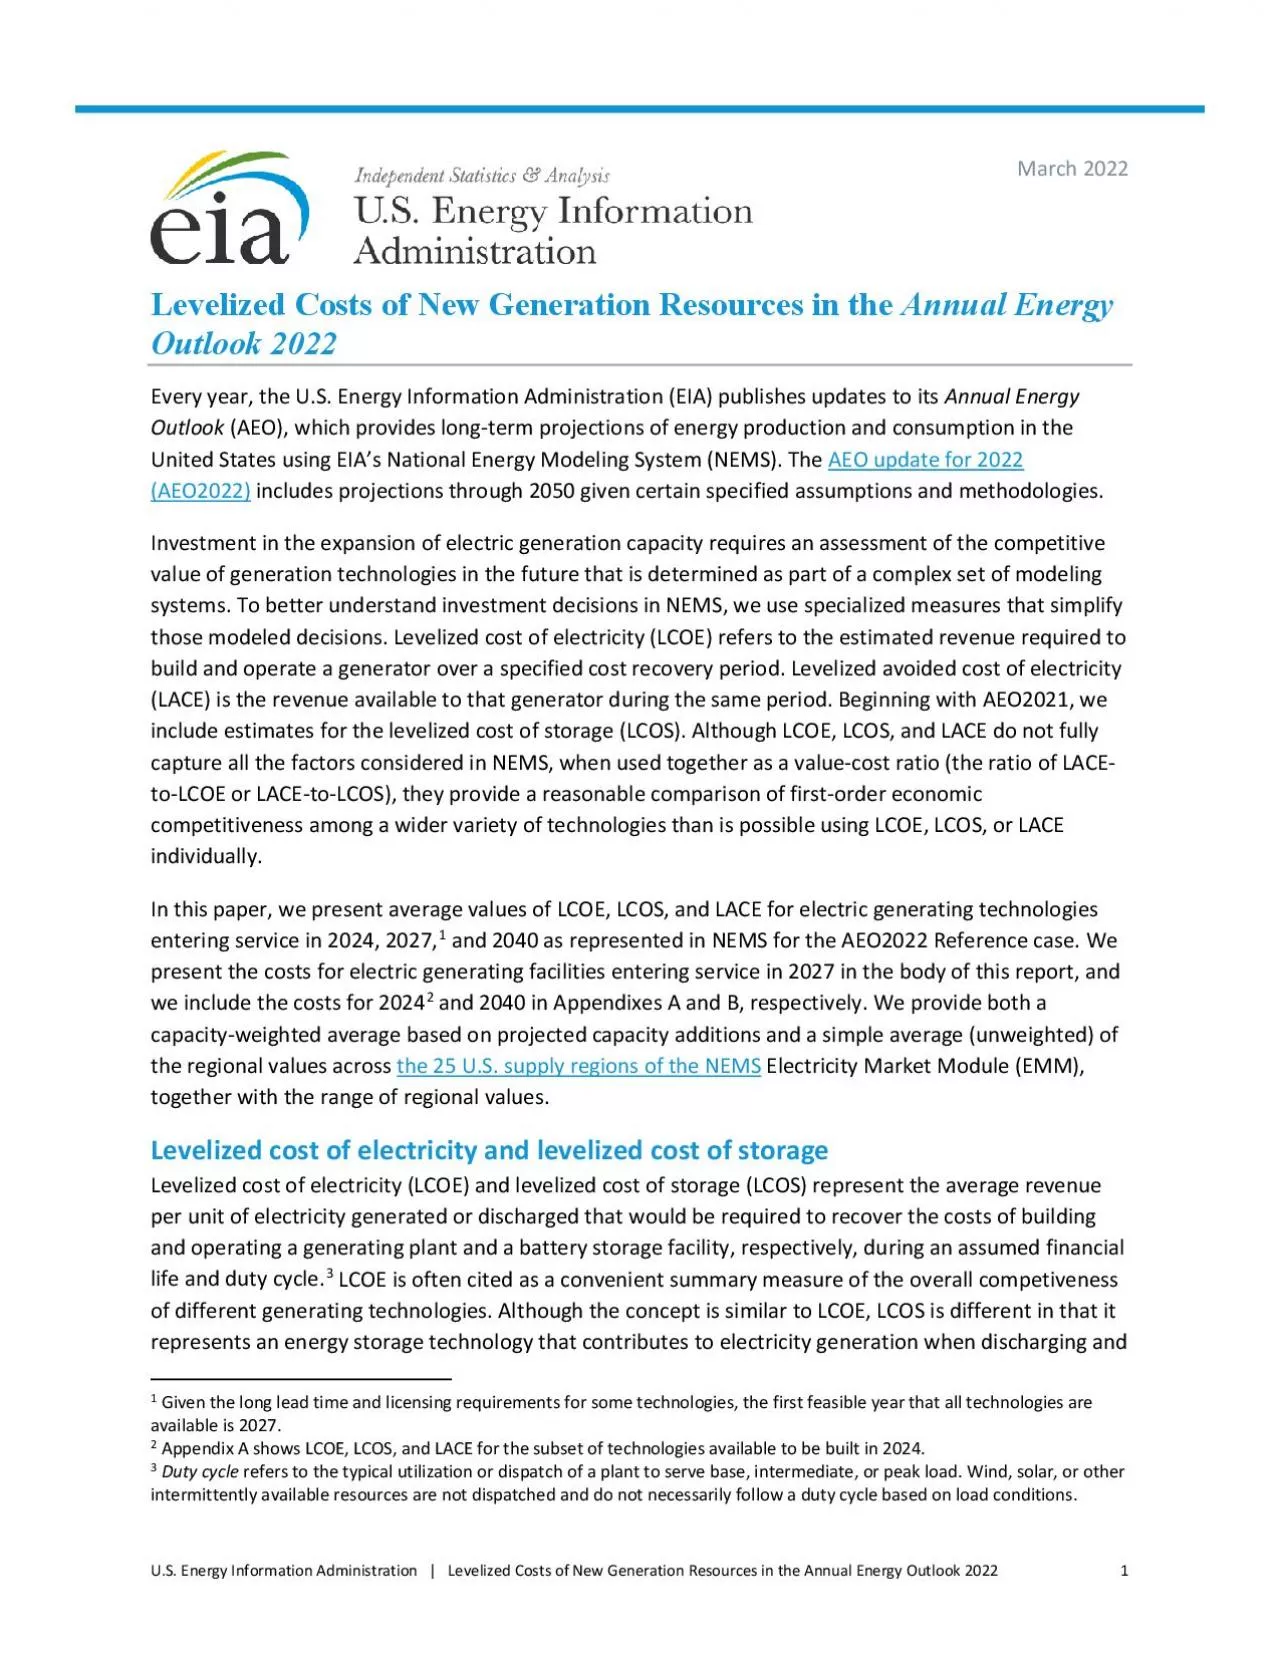
Levelized Costof New Generation Resourcesin the Annual Energy Outlook 2021Levelized cost of electricity LCOErefers to the estimates of the revenue required to build and operate a generator over a spec ID: 887378

levelized solar cost capacity solar levelized capacity cost technologies average energy tax hybrid lcoe system wind storage resources technology

Share:

Link:

Embed:

Download Presentation from below link

Download Pdf The PPT/PDF document "x0000x0000US Energy Information Administ..." is the property of its rightful owner. Permission is granted to download and print the materials on this web site for personal, non-commercial use only, and to display it on your personal computer provided you do not modify the materials and that you retain all copyright notices contained in the materials. By downloading content from our website, you accept the terms of this agreement.


Presentation Transcript

1 ��U.S. Energy Information
��U.S. Energy Information Administration | Levelized Costof New Generation Resources in the Annual Energy Outlook 2021February2021 Levelized Costof New Generation Resourcesin the Annual Energy Outlook 2021 Levelized cost of electricity (LCOE)refers to the estimates of the revenue required to build and operate a generator over a specified cost recovery period lectricity arket odule (EMM) are provided, together with the range of regional values. LCOE, LCOS,and LACE are simplifications of modeled decisions, and do notnot fully capture all the factors considered in NEMS. Neverthele, when used together, the cost and revenue metrics provide amoreintuitive framework for understanding Given the long lead is available on EIA’s website. Appendix A shows LCOE, LCOS, and LACE for the subset of technologies available to be built in 2023.Duty cyclerefers to the typical utilization or dispatch of a plant to serve base, intermediate, or peak load. Wind, solar, or other intermittently available resources are not dispatched and do not necessarily follow a duty cycle based on load conditions. ��U.S. Energy Information Administration | Levelized Costof New Generation Resources in the Annual Energy Outlook 2021 AEO2021representation of tax incentives for renewable generation Federal tax credits for certain renewable generation facilities cansubstantially reduce the realized cost of these facilities. here applicable, LCOE is shown both with and without tax credits that EIA assumed wouldbe available in the year in which the plant enters servicebased on the following representation Production ax redit (PTC):New wind, geothermal, and closedloop biomass plants receive $25 per megawatthour (MWh) of generation; other PTCeligible technologies receive $13/MWh. The PTC values are adjusted for inflation and are applied duringthe plant’s first years of service. Plants that were under construction before the end of 2016received the full PTC. After 2016windcontinues to be eligible for the PTCbut at adeclining dollarspermegawatthourrateEIA assumes that wind plants have five years after beginning constructionto come online and claim the PTCed on Division Q Taxpayer Certainty and Disaster Tax Relief Act of 2019of the Further Consolidated Appropriation Act, signed into law in December 2019 and Notice 2020 released by the Internal Revenue Service IRSin May 2020. As a result, wind plants entering service before 2025 will receive 60% of the full PTC value (inflation adjusted). Investment ax redit (ITC):In June 2018, the IRS issued Notice 2018 which wasbeginning construction guidance for the ITC. Based on theguideline, EIA assumes all solar projects coming online before January 1, 2024 will receive the full 30% ITC. Solar projects include both utilityscale solar plantsthose with capacity rating of 1 megawatt (MW) or greaterand

2 smallscale systemsthose systems with a
smallscale systemsthose systems with a capacity rating of less than 1 MW. All commercial and utilityscale plants with a construction start date on or after January 1, 2022, or those plants placed in service after December 31, 2023, receive a 10% ITC.The ITCexpires completely, however,for residentialowned systems starting in Results in thislevelized costreport only include utilityscale solar facilities and do noinclude smallscale solar facilities. Because batterystorage is assumed to be a standalonegridconnected system, it is not eligible fortheITC. However, battery storage in the solar PV hybrid system is modeled as a colocated systemandtherefore eligible for the ITC with the same phaseout schedule as for standalone solar PV system Both onshore and offshore wind projects are eligible to claim the ITC in lieu of the PTC. Although EIA expects that onshore wind projects will choose the PTC, EIA assumes offshore wind projects will claim the ITC because of the relatively higher capital costs for those projects. Key inputs to calculating LCOEand LCOS include capital costs, fixed operations and maintenance (O&M) costs, variable coststhat include O&M and fuel costs, financing costs, and an assumed utilization rate for each plant type.For LCOS, in lieu of fuel cost, the levelized variable cosincludes the cost of purchasing electricity from the electric power grid for charging. The importance of each of thefactors varies acrosstechnologies. For technologies with no fuel costs and relatively small variable costssuch as solar and wind electric generating technologies, LCOEchangesnearlyin proportion to the estimated capital cost of the technology. For technologies with significant fuel cost, both fuel cost and capital cost estimates significantly affect LCOE. ncentives, including state or federal tax credits(see text boxAEO2021representation of tax incentives for renewable generation, also affectthe calculation of LCOE The specific assumptions for each of these factors are providedin the Assumptions tothe Annual Energy Outlook . ��U.S. Energy Information Administration | Levelized Costof New Generation Resources in the Annual Energy Outlook 2021As with any projection, these factorsare uncertain becausetheir values can vary regionally and temporallyas technologies evolveand fuel prices changeolar photovoltaic (PV) hybrid technologyis represented by LCOE and not LCOS becauseEIA assumes itoperateintegrated unit supplying electricity to the grid.ctual plant investment decisions considerthe specific technological and regional characteristics of a project, which involve manyother factors not reflected in LCOE (or LCOS) valuesOne such factor is theprojected utilization ratewhich depends on the varying amount of electricity required over time and the existing resource mix in an area where additional capacity is needed. A related factor is t

3 he capacity valuewhich depends on both t
he capacity valuewhich depends on both the existing capacity mix and load characteristics in a regionBecauseload must be continuously balanced, generating units with the capability to vary output to follow demand (dispatchable technologies) generally have more value to a system than less flexible units (nondispatchable technologies)that use intermittent resources to operate. The LCOE valuesfor dispatchable and nondispatchable technologies are listed separately in the following tablesbecause comparing them must be done carefullyThe solar PV hybrid LCOE is included under nondispatchable technologies because, much like hydroelectric generators, solar PV hybrid generators are energyconstrained and are more limited in dispatch capability than generators with essentially continuous fuel supply. For batterystorage, capacity might be added in regions with higher renewables penetration, particularly solar, to capture any curtailmentthat would otherwise occur during the daytimeallowing for higher levels of capacity additionsin those regionsLevelized Avoided Cost of ElectricityLCOE andLCOS do not capture all of the factors that contribute toactual investment decisionmaking direct comparisonof LCOEand LCOacross technologiesproblematic and misleading as a method to assess the economic competitiveness of various generation alternatives.Figure illustrates the limitations of using LCOE alone. n AEO2021, solar LCOE on average is lower than natural gasfiredcombinedcycle (CC) LCOEin More solar generating capacityis installed than CCbetween and Solar LCOE remains lower than CC LCOE on average in 2040, but EIA projects much more capacity to be installed thansolar capacity between 2038 and 2040Along with LCOEand LCOS, EIA compares economic competitiveness between generation technologies by considering the value of the plant in serving the electric grid. This value provides a proxy measure for potential revenues from sale of electricity generated from a candidate projectdisplacing (or the cost of avoiding) another marginal asset. EIAsums this valueover a project’s financial life and converts that sum into annualized valuethat isdivided bytheaverage annual output of the projectto develop the levelizedavoided cost ofelectricity LACEUsing LACE along with LCOEand LCOS provides a more intuitive indication of economic competitiveness for each technology than either metric separately when several technologies are available to meet load. EIA calculates LACELCOEand LACELCOratio(or valuecost ratio) for each technology to determine which project provides the most value relative to its cost. Projects with a valuecost ratio greater than one (that is, LACE is greater than LCOEor EIA’s website provides further discussion of the levelized avoided cost concept and its use in assessing economic competitiveness. ��U.S. Energy Information Administration | Leveli

4 zed Costof New Generation Resources in t
zed Costof New Generation Resources in the Annual Energy Outlook 2021LCOS) are more economically attractive as new builds than those with a valuecost ratio less than one that is, LACE is less than LCOEor LCOS).Figure . Levelized cost of electricity (with applicable tax subsidies) by region and total incremental capacity additions for selected generating technologies entering into service in 2026, and 2040Estimating LACE is more complex than estimating LCOEor LCObecause it requires information about how the gridwould operate without the new power plant or storage facility entering serviceEIA calculates LACEbased on the marginal value of energy and capacity that would result from adding a unit of a given technologyto the gridas it exists or is projected to exist at a specififuture dateLACE accounts for both the variation in daily and seasonal electricity demand and the characteristics of the existing generation fleet to which new capacity will be addedherefore, LACEcomparesthe prospective new generation resource against the mix of new and existing generation and capacity that it ould displaceFor example, a wind resource that would primarilydisplace generation from a relatively expensive natural gasfiredpeakingunit will usually have a different value than one that would displace generationfrom a more efficient natural gafired combinedcycle unit or coalfired unit with low fuel costsAlthough the modeled economic decisions for capacity additions in EIA’s longterm projections do not use the LACELCOEor LCOconceptsthe LACE and valuecost ratio presented in this report is generally more representative of the factors contributing to the builddecisions in EIA’s longterm projections than looking at LCOEor LCOalone. Figure shows selected generating technologies that arefeasible to come online in CC and PV are shown to be mostly economically attractive to build because the value (or LACE) is higher than the cost (or LCOE)nshore wind is shown to be adding capacity when it’s less economically attractiveThis is partly because capacity additions are from the preceding three years, which reflect the years where onshore wind was subject to greater tax incentives than in ��U.S. Energy Information Administration | Levelized Costof New Generation Resources in the Annual Energy Outlook 2021alone. In addition, some regions are adding uneconomic capacity builds to fulfill statelevel renewable portfolio standards (RPS)that require thata certain percentage of generation come from renewablesEven so, looking at both LCOE andLACE togetheras shown in Figure is more indicative of the fullanalysis from the AEO2021model than LCOE aloneestablishedFigure Figure . Levelized cost of electricity and levelized avoided cost of electricity by region for selected generation technologies, 2026 online yearNonetheless, the LACELCOE, and LCOestimates are simplifications of modeled decisions, and may not fu

5 lly capture all of the factors considere
lly capture all of the factors considered in NEMS or match modeled results.EIA calculates levelized costusing an assumed set of capital and operating costs, but investment decisions may be affected by factors other than the project’s value relative to its costs.For example, the inherent uncertainty about future fuel pricesfuture policies, or local considerations for system reliability may leadplant owners or investors who finance plants to place a value on portfolio diversificationor other riskrelated concernsEIA considers manyof these factors in its analyss of technology choice in the electricity sectorin NEMS, but not all of these concepts are included in LCOE, LCOor LACE calculations. Future policyrelated factors, such as new environmental regulations or tax credits for specific generation sources, can also affectinvestment decisions.The LCOE, LCOand LACE values presented here are derived from the AEO2021Reference case, which includes statelevel renewable electricity requirements as of October and a phaseout of federal tax credits for renewable generation. ��U.S. Energy Information Administration | Levelized Costof New Generation Resources in the Annual Energy Outlook 2021LCOE, LCOS,and LACE calculationsEIA calculates all levelized costs and valuesbased on a 30year cost recovery period, using a realaftertax weighted average cost of capital (WACC) of 5.4In reality, a plant’scost recovery period and cost of capital can vary by technology and project type. The represented technologies are selected from available utilityscale technologies modeled in EMM and not from distributed residential and commercial applications.Starting in AEO2020, EIA representsan ultrasupercritical(USC)coal generation technology without carbon capture and sequestration (CCS). In December 2018,theU.S. Environmental Protection Agency (EPA) amended earlier 2015 findings that partial CCS was the best system of emissions reductions(BSER) for greenhouse gas reductionsand proposedto replace it with the most efficient demonstrated steam cycle, which EIA assumes represented by ultrasupercriticalcoaltechnologyRegulatory or court actions related to power plant emissions taken after September 2020 are not accounted for in AEO20The levelized capital component reflects costs calculated using tax depreciation schedules consistent with tax laws without an enddate, which vary by technologyFor AEO2021EIA assumes a corporate tax rate of 21% as specified in the Tax Cuts and Jobs Act of For technologies eligible for theInvestment Tax Creditor Production Tax Credit (PTCEIA reports LCOE both with and without tax credits, which phaseout and expire based on current laws and regulationsin AEO2021casesCosts are expressed in terms of net alternating current (ACpower available to the grid for the installed capacityEIA evaluated LCOE, LCOand LACE for each technology based on assumed capacity factors, which generally c

6 orrespond to the high end of their likel
orrespond to the high end of their likely utilization range. This convention is consistent with usingLCOEand LCOS to evaluate competing technologies in baseload operation such as coal and nuclear plants. Although sometimes used in baseload operation, some technologies, such as CC plants, are also built to serve loadfollowing or other intermediate dispatch duty cycles. Combustion turbines that are typically used for peakload duty cycles are evaluated at a 10% capacity factor, which reflects the historical average utilization rate. Batterystorage is also evaluated at a 10% capacity factor, reflecting an expected use for energy arbitrage, especially in conjunction with intermittent renewable generation such as solar generation. The duty cycle for intermittent resources is not operator controlled, but rather, it depends on the weather, which does not necessarily correspond to operatordispatched duty cycles. As a result, LCOE values for wind and solar technologies are not directly comparable with the LCOE values for other technologies thatmay have a similar average annual capacity factor. As a result, wind and solar technologiesare shown separately as nondispatchable technologies. Hydroelectric resources, including facilities where storage reservoirs allow for more flexible dayday operation, and hybrid solar PV generally have signifcant seasonal and daily variation, respectively, in availability. EIA shows them as nondispatchable to discourage comparison with technologies that have more consistent EIA uses this WACC or plants entering service in 2026. he real WACCused to calculate LCOE for plants entering service in 2023 and 2040 are 4.8% and 6.3%, respectively. An overview of the WACC assumptions and methodology is available in the Electricity Market Module of the National Energy Modeling System: Model Documentation 2020 . The list of all technologies modeled in EMM is available in the Electricity Market Module of the National Energy Modeling System: Model Documentation 2020 . USC coal plants are compatible with CCS technologies because they use boilers that heat coal to higher temperatures, which increases the pressure of steam to improve efficiency and results in less coal use and fewer carbon emissions than other boiler technologies. ��U.S. Energy Information Administration | Levelized Costof New Generation Resources in the Annual Energy Outlook 2021seasonal and diurnal availability. The capacity factors for solar, wind, and hydroelectric resources are the average of the capacity factors (weighted or unweighted) for the marginal site in each region, which can vary significantly by region, and will not necessarily correspond to the cumulative projected capacity factors for both new and existing units for resources in AEO2021 or in other EIA analyses.The LCOE and LCOS values shown in Table1a and 1b are averages ofregionspecific v

7 alues weighted bythe projected regional
alues weighted bythe projected regional capacity buildsAEO2021(Table 1a) and unweightedaverages(simple average, Table 1b)for new plants coming online in EIA developed the weights based on the cumulative capacity additions during three years, reflecting the two years precedingthe online year and the online year (for examplethe capacity weight for a online year represents the cumulative capacity additions from through Table 1a. Estimated capacityweightedlevelized cost of electricity LCOE) and levelized cost of storage (LCOS) for new resourcesentering service in 2026 2020 dollars per megawatthour Plant type Capacity factor ( percent ) Levelized capital cost Levelized fixed O&M 2 Levelized variable cost Levelized transmis - sion cost Total system LCOE or LCO S Levelized tax credit 3 Total LCOE or LCO S including tax credit Dispatchable technologies Ultra - super critical coal NB NB NB NB NB NB NB NB Combined cycle 87 % $ 7.00 $ 1.61 $ 24.97 $ 0.93 $ 34.51 NA $ 34.51 Combustion turbine 10 % $ 45.65 $ 8.03 $45.59 $ 8.57 $107.83 NA $107.83 Advanced nuclear NB NB NB NB NB NB NB NB Geothermal 90 % $ 18.60 $ 14.97 $ 1.17 $ 1.28 $ 36.02 - $ 1.86 $ 34.16 Biomass NB NB NB NB NB NB NB NB Battery storage 10 % $ 57.51 $ 28.48 $ 23.93 $ 11.92 $ 121.84 NA $ 121.84 Non - dispatchable technologies Wind, onshore 41 % $ 21.42 $ 7.43 $ 0.00 $ 2.61 $ 31.45 $ 0.00 $ 31.45 Wind, offshore 45 % $ 84.00 $ 27.89 $ 0.00 $ 3.15 $ 115.04 NA $ 115.04 Solar , standalone 4 30 % $ 22.60 $ 5.92 $ 0.00 $ 2.78 $ 31.30 - $ 2.26 $ 29.04 Solar, hybrid 4,5 30 % $ 29.55 $ 12.35 $ 0.00 $ 3.23 $ 45.13 - $ 2.96 $ 42.18 Hydroelectric 5 NB NB NB NB NB NB NB NB Source: U.S. Energy Information Administration, Annual Energy Outlook 2021 1 The capacityweighted average is the average levelized cost per technology, weighted by the new capacity coming online in each region. The capacity additions for each region are based on additions from to . Technologies for which capacity additions are not expected do not have a capacity weighted average and are marked as or not built 2 O&M = operationand maintenance 3 The tax credit component is based on targeted federal tax credits such as the production tax credit PTCor investment tax c redit ITCavailable for some technologies. It reflects tax credits available only forplants entering service in and the substantial phaseout of both the PTC and ITC as scheduled under current law. Technologies not eligible for PTC or ITC are indicated as or not available. The results are based on a regional model, and state or local incentives are not included in LCOE and LCOS calculations. See text box on page 2 for details on how the tax

8 credits are represented in the model. 4
credits are represented in the model. 4 Technology is assumed to be photovoltaic(PV)with singleaxis trackingThe solar hybrid system issingleaxis PV system coupled with fourhour battery storage system. Costs are expressed in terms of net ACalternating currentpower available to the grid for the installed capacity. 5 As modeled, EIA assumes that hydroelectric and hybrid solar PV generating assets have seasonal and diurnal storage respectively, so that they can be dispatched within a seasonor a day, but overall operation is limited by resource availablilityby site and season for hydroelectric and by daytime for hybrid solar PV . ��U.S. Energy Information Administration | Levelized Costof New Generation Resources in the Annual Energy Outlook 2021Table b. Estimated unweighted levelized cost of electricity (LCOE) and levelized cost of storage (LCOS) for new resources entering service in 2026 (2020 dollars per megawatthour) Plant type Capacity factor ( percent ) Levelized capital cost Levelized fixed O&M 1 Levelized variable cost Levelized transmis - sion cost Total system LCOE or LCO S Levelized tax credit 2 Total LCOE or LCO S including tax credit Dispatchable technologies Ultra - super critical coal 85 % $ 43.80 $ 5.48 $ 22.48 $ 1.03 $ 72.78 NA $ 72.78 Combined cycle 87 % $ 7.78 $ 1.61 $ 26.68 $ 1.04 $ 37.11 NA $ 37.11 Combustion turbine 10 % $ 45.41 $ 8.03 $44.13 $ 9.05 $106.62 NA $106.62 Advanced nuclear 90 % $ 50.51 $ 15.51 $ 2.38 $ 0.99 $ 69.39 - $ 6.29 $ 63.10 Geothermal 90 % $ 19.03 $ 14.92 $ 1.17 $ 1.28 $ 36.40 - $ 1.90 $ 34.49 Biomass 83 % $ 34.96 $ 17.38 $ 35.78 $ 1.09 $ 89.21 NA $ 89.21 Battery storage 10 % $ 57.98 $ 28.48 $ 23.85 $ 9.53 $ 119.84 NA $ 119.84 Non - dispatchable technologies Wind, onshore 41 % $ 27.01 $ 7.47 $ 0.00 $ 2.44 $ 36.93 NA $ 36.93 Wind, offshore 44 % $ 89.20 $ 28.96 $ 0.00 $ 2.35 $ 120.52 NA $ 120.52 Solar , standalone 3 29 % $ 23.52 $ 6.07 $ 0.00 $ 3.19 $ 32.78 - $ 2.35 $ 30.43 Solar, hybrid 3,4 28 % $ 31.13 $ 13.25 $ 0.00 $ 3.29 $ 47.67 - $ 3.11 $ 44.56 Hydroelectric 4 55 % $ 38.62 $ 11.23 $ 3.58 $ 1.84 $ 55.26 NA $ 55.26 Source: U.S. Energy Information Administration, Annual Energy Outlook 2021 O&M = operationsand maintenanceThe tax credit component is based on targeted federal tax credits such as the production tax credit PTCor investment tax redit ITCavailable for some technologies. It reflects tax credits available only for plants entering service in and the substantial phaseout of both the PTC and ITC as scheduled under current law. Technologies not eligible for PTC or ITC are indicated as or not available. The results are based on a regional model, and s

9 tate or local incentives are not include
tate or local incentives are not included in LCOE and LCOScalculations. See text box on page 2 for details on how the tax credits are represented in the model.Technology is assumed to be photovoltaic(PV)with singleaxis tracking. The solar hybrid system is singleaxis PV system coupled with a fourhour battery storage system. Costs are expressed in terms of net ACalternating currentpower available to the grid for the installed capacity. As modeled, EIA assumes that hydroelectric and hybrid solar PV generating assets have seasonal and diurnal storagerespectively,so that they can be dispatched within a seasonor a day, but overall operation is limited by resource availablility by site and season for hydroelectric and by daytime for hybrid solar PV . ��U.S. Energy Information Administration | Levelized Costof New Generation Resources in the Annual Energy Outlook 2021Table 2 showsa range of LCOEand LCOvalues, which representthe significant regional variation attributed to local labor markets and the cost and availability of fuel or energy resources such as windy sites. For example, the LCOE for incremental onshore wind capacity ranges from $26.33per megawatthour (MWhin the region with the highestqualitywind resourcesto $56.94/MWh in the region with the lowestquality wind resources and/or higher capital costs for the best sites.Because onshore wind plants will most likely be built in regions that offer low cost and high value, the weighted average cost across regions is closer to the low end of the range at $31.45/MWh.Costs for wind generators may include additional expenses associated with transmission upgrades needed to access remote resources, as well as other factors that markets may not internalize into the market price for wind power.Table 2. Regional variation in levelized cost of electricity (LCOE) and levelized cost of storage (LCOS) for new resourcesentering service in2020 dollars per megawatthour Without tax credits W ith tax credits 1 Plant type Minimum Simple average Capacity - weighted average 2 Maximum Minimum Simple average Capacity - weighted average 2 Maximum Dispatchable technologies Ultra - supercritical coal $ 64.98 $ 72.78 NB $ 88.45 $ 64.98 $ 72.78 NB $ 88.45 Combined cycle $ 31.67 $ 37.11 $ 34.51 $ 44.68 $ 31.67 $ 37.11 $ 34.51 $ 44.68 Combustion turbine $94.63 $106.62 $107.83 $129.91 $94.63 $106.62 $107.83 $129.91 Advanced nuclear $ 64.82 $ 69.39 NB $ 78.15 $ 58.52 $ 63.10 NB $ 71.85 Geothermal $ 33.41 $ 36.40 $ 36.02 $ 39.55 $ 31.80 $ 34.49 $ 34.16 $ 37.59 Biomass $ 70.95 $ 89.21 NB $ 130.97 $ 70.95 $ 89.21 NB $ 130.97 Battery storage $ 109.53 $ 119.84 $ 121.84 $ 131.42 $ 109.53 $ 119.84 $ 121.84 $ 131.42 Non - dispatchable technologies Wind, onshore $ 26.33 $ 36.93 $ 31.45 $ 56.

10 94 $ 26.33 $ 36.93 $ 31.45 $ 56.
94 $ 26.33 $ 36.93 $ 31.45 $ 56.94 Wind, offshore $ 97.52 $ 120.52 $ 115.04 $ 149.53 $ 97.52 $ 120.52 NB $ 149.53 Solar, standalone 3 $ 27.28 $ 32.78 $ 31.30 $ 43.90 $ 25.32 $ 30.43 $ 29.04 $ 40.67 Solar, hybrid 3 , 4 $ 39.54 $ 47.67 $ 45.13 $ 62.11 $ 36.98 $ 44.56 $ 42.18 $ 57.92 Hydroelectric 4 $ 41.92 $ 55.26 NB $ 70.60 $ 41.92 $ 55.26 NB $ 70.60 Source: U.S. Energy Information Administration, Annual Energy Outlook 2021 Note: EIA calculated the levelized costs for nondispatchable technologies based on the capacity factor for the marginal site modeled in each region , which can vary significantly by region. The capacity factor ranges for these technologies are % for onshore wind, 41% 50% for offshore wind, 2% for standalone solar PV, 32% for hybrid solar PV, and 25%% for hydroelectric. The levelized costs are also affected by regional variations in construction labor rates and capital costs as well as resource availability. 1 Levelized cost with tax credits reflects targeted federal tax credits such as the production tax credit PTCor investment tax c redit ITCavailable for plants entering service in 2023 and the substantial phaseout of both the PTC and ITC as scheduled under current law. 2 The capacityweighted average is the average levelized cost per technology, weighted by the new capacity comingonline in each region. The capacity additions for each regio n are based on additions fromto . Technologies for which capacity additions are not expected do not have a capacity weighted average and are marked as or not built 3 Technology is assumed to be photovoltaic (PV) with singleaxis tracking. The solar hybrid system is singleaxis PV system coupled with a fourhour battery storage system. Costs are expressed in terms of net ACalternating currentpower available to the grid for the i nstalled capacity. 4 As modeled, EIA assumes that hydroelectric and hybrid solar PV generating assets have seasonal and diurnal storage respectively, so that they can be dispatched within a seasonor a day, but overall operation is limited by resource availablility by site and season for hydroelectric and by daytime for hybrid solar PV . ��U.S. Energy Information Administration | Levelized Costof New Generation Resources in the Annual Energy Outlook 2021LACE accounts for the differences in the grid services that each technology providesand recognizesthatintermittent resources, such as wind or solar, have substantially different duty cycles than the baseload, intermediateand peaking duty cycles of conventional generators. Table 3 provides the range of LACE estimates for different capacity types. EIA calculated the LACE in this table by assuming the same maximum capacity factor as used for the LCOEand LCOcalculationsLACE values for combustion turbine and batterystorage are the samesince

11 EIA assumes both technologies service th
EIA assumes both technologies service the same peakdemand duty cycleTable 3. Regional variation in levelized avoided cost of electricity (LACE) for new resourcesentering service in2026 2020 dollars per megawatthour Plant type Minimum Simple average Capacity - weighted average 1 Maximum Dispatchable technologies Ultra - supercritical coal $ 30.82 $ 35.59 NB $ 40.05 Combined cycle $ 30.68 $ 36.35 $ 34.58 $ 44.85 Combustion turbine $ 66.86 $ 90.95 $ 93.59 $ 119.43 Advanced nuclear $ 30.75 $ 35.41 NB $ 39.79 Geothermal $ 37.44 $ 40.89 $ 41.48 $ 44.52 Biomass $ 30.92 $ 36.60 NB $ 45.17 Battery storage $ 66.86 $ 90.95 $ 97.53 $ 119.43 Non - dispatchable technologies Wind, onshore $ 26.17 $ 31.87 $ 30.71 $ 47.42 Wind, offshore $ 28.50 $ 33.19 NB $ 42.63 Solar , standalone 2 $ 27.45 $ 31.66 $ 30.63 $ 38.78 Solar, hybrid 2,3 $ 28.74 $ 42.74 $ 44.45 $ 55.48 Hydroelectric 3 $ 29.41 $ 34.74 NB $ 43.49 Source: U.S. Energy Information Administration, Annual Energy Outlook 2021 The capacityweighted average is the average levelized cost per technology, weighted by the new capacity coming online in each region. The capacity additions for each region are based on additions fromto . Technologies for which capacity additions are not expected do not have a capacityweighted average and are marked as NBor not builtTechnology is assumed to be photovoltaic (PV) with singleaxis tracking. The solarhybrid system is singleaxis PV system coupled with a fourhour battery storage system. Costs are expressed in terms of net ACalternating currentpower available to the grid for the installed capacity. As modeled, EIA assumes that hydroelectric and hybrid solar PV generating assets have seasonal and diurnal storagerespectively,so that they can be dispatched within a seasonor a day, but overall operation is limited by resource availablility by site and season for hydroelectric and by daytime for hybrid solar PV . When the LACE of a particular technology exceeds its LCOEor LCO, that technology would generally be economically attractive to build.he build decisions in the real worldand as modeled in AEO2021, however, are more complex than a simple LACELCOEor LACELCOcomparisonbecause they include factors such as policy and noneconomic driversNevertheless, the valuecost ratiothe ratio of LACELCOEor LACELCOprovidea reasonable point of comparison of firstorder economic competitiveness among a wider variety of technologies than is possible using LCOE, LCOS,or LACE tables individually.In Tablea and 4b, a value index less than one indicates that the cost of the marginal new unit of capacity exceeds its value to the system, and valuecost ratiogreater than one indicates that the marginal new unit brings in value higher than its cost by displacing more expensive generat

12 ion and capacity options.The verage luec
ion and capacity options.The verage luecost ratio represents the average of the ratio of the LACELCOEor LACELCOcalculation, where the ratio is calculated for each of the 2EMMregions.his ��U.S. Energy Information Administration | Levelized Costof New Generation Resources in the Annual Energy Outlook 2021range of ratios is not based on the ratio between the minimumand maximumvalues shown in Tables 2 and but rather represents the lower and upper boundresulting from the ratio of LACELCOEand LACELCOcalculations for each of the 25regions.As shown in Table 4a, the capacityweighted average valuecost ratio is greater than one for both standalone and hybrid solar PV and geothermal in 2026, suggesting that these technologies will be built in regions where they are economically viable. Furthermore, the capacityweighted average valuecost ratio for CC is one, suggesting that the technology is an attractive marginal capacity addition and that the market has developed the technology to an equilibrium point where the net economic value is close to breakeven after having met load growth or displaced higher cost generationTable 4a. Valuecost ratio (capacityweighted) for new resources entering service in 2026 Plant type Average capacity - weightedLCOEor LCOwith tax credits dollars per megawatthour ) AveragecapacityweightedLACE dollars per megawatthour ) Average value - cost ratio 3 Dispatchable technologies Ultra - supercritical coal NB NB NB Combined cycle $ 34.51 $ 34.58 1.00 Combined turbine $107.83 $ 93.59 0.87 Advanced nuclear NB NB NB Geothermal $ 34.16 $ 41.48 1.22 Biomass NB NB NB Battery storage $ 121.84 $ 97.53 0.80 Non - dispatchable technologies Wind, onshore $ 31.45 $ 30.71 0.98 Wind, offshore NB NB NB Solar , standalone 4 $ 29.04 $ 30.63 1.06 Solar, hybrid 4,5 $ 42.18 $ 44.45 1.06 Hydroelectric 5 NB NB NB Source: U.S. Energy Information Administration, Annual Energy Outlook 2021 he capacityweighted average is the average levelized cost per technology, weighted by the new capacity coming online in each region. The capacity additions for each region are based on additions fromto . Technologies for which capacity additions are not expected do not have a capacityweighted average and are marked as NBor not builtLCOE = levelized cost of electricityLCOS = levelized cost of storage, and LACE = evelized avoided cost of electricityThe verage valuecost ratio is an average of 25 regional valuecost ratios based on the cost with tax credits for each technology, as available.Technology is assumed to be photovoltaic (PV) with singleaxis tracking. The solar hybrid system is singleaxis PV system coupled with a fourhour battery storage system. Costs are expressed in terms of net ACalternating currentpower available to the grid for the installed capacity. As

13 modeled, EIA assumes that hydroelectric
modeled, EIA assumes that hydroelectric and hybrid solar PV generating assets have seasonal and diurnal storagerespectively,so that they can be dispatched within a seasonor a day, but overall operation is limited by resource availablility by site and season for hydroelectric and by da ytime for hybrid solar PV . For a more detailed discussion of the LACE versus LCOE measures, see Assessing the Economic Value of New UtilityScale Electricity Generation Projects . ��U.S. Energy Information Administration | Levelized Costof New Generation Resources in the Annual Energy Outlook 2021Table 4b. Valuecost ratio (unweighted) for new resourcesentering service in2026 Plant type Average unweighted LCOEor LCO with tax credits dollars per megawatthour ) Average unweightedLACE 1 (2020 dollars per megawatthour ) Average value cost ratio 2 Minimum 3 Maximum 3 Dispatchable technologies Ultra - supercritical coal $ 72.78 $ 35.59 0.49 0.39 0.57 Combined cycle $ 37.11 $ 36.35 0.98 0.83 1.04 Combustion turbine $106.62 $ 90.95 0.85 0.65 1.05 Advanced nuclear $ 69.39 $ 35.41 0.56 0.49 0.67 Geothermal $ 36.40 $ 40.89 1.19 1.03 1.40 Biomass $ 89.21 $ 36.60 0.41 0.29 0.48 Battery storage $ 119.84 $ 90.95 0.76 0.54 0.95 Non - dispatchable technologies Wind, onshore $ 36.93 $ 31.87 0.88 0.64 1.07 Wind, offshore $ 120.52 $ 33.19 0.28 0.21 0.36 Solar , standalone 4 $ 32.78 $ 31.66 1.05 0.90 1.17 Solar, hybrid 4,5 $ 47.67 $ 42.74 0.96 0.72 1.11 Hydroelectric 5 $ 55.26 $ 34.74 0.64 0.49 0.84 Source: U.S. Energy Information Administration, Annual Energy Outlook 2021 LCOE = levelized cost of electricityLCOS = levelized cost of storage, and LACE = levelized avoided cost of electricityThe verage valuecost ratio is an average of 25 regional valuecost ratios based on the cost with tax credits for each technology, as available.The range of unweighted valuecost ratio represents the lower and upper bounds resulting from the ratio of LACELCOEor LACELCOS calculations for each of the 25 regions.Technology is assumed to be photovoltaic (PV) with singleaxis trackingThe solar hybrid system is singleaxis PV system coupled with a fourhour battery storage system. Costs are expressed in terms of net ACalternating currentpower available to the grid for the installed capacity. As modeled, EIA assumes that hydroelectric and hybrid solar PV generating assets have seasonal and diurnal storagerespectively,so that they can be dispatched within a seasonor a day, but overall operation is limited by resource availablility by site and season for hydroelectric an d by daytime for hybrid solar PV . LCOE and LACE projectionsFigure shows capacityweighted and unweighted LCOE for , solar PV, and onshore wind

14 plants entering service from to 50 in th
plants entering service from to 50 in the AEO2021Reference caseChanges in costover time reflect a number of different model factors, sometimes working in different directions.For both solar PV and onshore wind, LCOE increases in the nearterm with the phasedownand expiration of ITC and PTC, respectively.However, LCOE eventually declines over time because of technology improvement that tends to reduce LCOE through lower capital costs or improved performance (as measured by heat rate for plants or capacity factor for onshore wind or solar PV plants), offsetting he loss of the tax credits.The availability of highquality resources may also be a factor. As the best, leastcost resources are usedfirst, future development will occur in lessfavorable areas, potentially resulting inlowerperforming resources,higher project development costs, and higher costs to access transmission lines. For , changing fuel prices also factorinto the change in LCOE, as well as any environmental regulations that affect capital or operating costs. ��U.S. Energy Information Administration | Levelized Costof New Generation Resources in the Annual Energy Outlook 2021Figure . Capacityweighted and unweighted levelized cost of electricity(LCOE)projectionand threeyear movingcapacity additions r selected generating technologiesFor all three technologies, the capacityweighted average LCOE and unweighted average LCOE are not far apart from each otherIn addition, all three technologies continue to be installed throughout the projection period so the capacityweighted average LCOE stays lower than the unweighted LCOE, reflecting the buildout in lowcost regions. The capacityweighted average LCOE and unweighted average LCOE for solar PV are closer to each other because new builds are expected across many regions throughout the projection periodprojectedregional range for CCis generally narrow in the early years, but this range widens in later years because ofthe increasevariable costfor plants in Californiaas a result ofCalifornia’s phaseout of fossil fuel generation starting in 2030.Figure shows capacityweighted and unweighted average LACE over time. Changes in the value of generationrepresented by LACEareprimarilya function of load growth. olar may show strong daily or seasonal generation patternswithin any given region; as a result, the LACE value significantly decreases as these time periods become more saturated with generation from solar resourceswith similar hourly operation patternsAs this saturation occurs,generation from new facilities must compete with lowercost options in the dispatch merit order.The LACE for onshore wind, on the other hand,increases throughout the projection period. ��U.S. Energy Information Administration | Levelized Costof New Generation Resources in the Annual Energy Outlook 2021Figure Capacityweightedand unweighted levelized avoided costof electricity (LACE) pro

15 jections and threeyearmovingcapacity add
jections and threeyearmovingcapacity additions for selected generating technologies, Similar behaviors and patterns emergewith LACE as with LCOE; the capacityweighted and the unweighted LACE stay close to each other throughout the projection period while the capacityweighted LACE generally remains lower than the unweighted LACEAs illustrated in Figure , when considering both the value and cost of building and operating a power plant, , solar PV, and onshore wind all reach market equilibriumor breakeven point.The breakeven point represents a stable solution point where LACE equalsLCOE.Once a technology achieves a valuecost ratio greater than one, its valuecost ratio tends to remain close to oneas seen with and solar PVIf the valuecost ratiois less than one, as seen with onshore wind in the near to midterm, continued load growth, technology cost declines, or perhaps escalation in the fuel cost of a competing resource will tend to reduce the technology costs or increase the technology value to the grid over time.Similarly, if the valuecost ratio becomes significantly greater than one, the market will quickly buildout the technology until it meets the demand growth or displaces the higher cost incumbent generation.In all technologies, the capacityweighted valuecost ratio stays mostly above the unweighted valuecost ratio, indicating that the capacity is being added in regions where it is most economical. ��U.S. Energy Information Administration | Levelized Costof New Generation Resources in the Annual Energy Outlook 2021Figure . Valuecost ratio and threeyear moving capacity additions for selected generating technologies, Market shocks may cause a divergence between LACE and LCOEandtherefore disturb the market equilibrium. These market shocks include technology change, policy developments, or fuel price volatility that can increase or decrease the valuecost ratio of any given technology. HoweveEIA expects the marketto reverse the divergence by either building the highvalue resource (if the valuecost ratio increased) or waiting for slowacting factors such as load growth to increase the value in the se of valuecost ratio decrease, as seen for the capacityweighted average valuecost ratios of both wind and solar PV ��U.S. Energy Information Administration | Levelized Costof New Generation Resources in the Annual Energy Outlook 2021 AppendixA: LCOE tables for new generation resources entering service in 2023 Table A1a. Estimated capacityweightedlevelized cost of electricityLCOE) and levelized cost of storage (LCOS) for new resources entering service in 20232020dollars per megawatthour Plant type Capacity factor ( percent ) Levelized capital cost Levelized fixed O&M 2 Levelized variable cost Levelized transmis - sion cost Total system LCOE or LCO S Levelized tax credit 3 Total LCOE or LCO S including tax credit Dispatchab

16 le technologies Combined cycle 87 %
le technologies Combined cycle 87 % $ 6.77 $ 1.61 $ 23.93 $ 0.89 $ 33.21 NA $ 33.21 Combustion turbine 10 % $ 42.74 $ 8.03 $38.89 $ 7.85 $97.50 NA $97.50 Battery storage 10 % $ 54.44 $ 28.45 $ 28.19 $ 10.78 $ 121.85 NA $ 121.85 Non - dispatchable technologies Wind, onshore 39 % $ 20.36 $ 7.80 $ 0.00 $ 2.28 $ 30.44 - $ 7.98 $ 22.46 Solar , standalone 4 31 % $ 22.37 $ 5.77 $ 0.00 $ 2.49 $ 30.63 - $ 6.71 $ 23.92 Solar, hybrid 4 , 5 NB NB NB NB NB NB NB NB Source: U.S. Energy Information Administration, Annual Energy Outlook 2021 1 The capacityweighted average is the average levelized cost per technology, weighted by the new capacity coming online in each region. The capacity additions for each region are based on additions from 2021 to 2023Technologies for which capacity addition s are not expected do not have a capacityweighted average and are marked as or not built 2 O&M = operationand maintenance 3 The tax credit component is based on targeted federal tax credits such as the roduction ax redit (PTC) or nvestment ax C redit (ITC) available for some technologies. It reflects tax credits available only for plants entering service in and the substantial phaseout of both the PTC and ITC as scheduled under current law. Technologies not eligible for PTC or ITC are indica ted as or not available. The results are based on a regional model, and state or local incentives are not included in LCOE and LCOcalculations. See text box on page 2 for details on how the tax credits are represented in the model. 4 Technology is assumed to be photovoltaic(PV)with singleaxis tracking. The solar hybrid system issingleaxis PV system coupled with a fourhour battery storage system. Costs are expressed in terms of net ACalternating currentpower available to the grid for the installed capacity. 5 As modeled, EIA assumes that hybrid solar PV generating assets have diurnal storage so that they can be dispatched within a day , but overall operation is limited by resource availabl ility b y daytime for hybrid solar PV . ��U.S. Energy Information Administration | Levelized Costof New Generation Resources in the Annual Energy Outlook 2021Table A1b. Estimated unweighted levelized cost of electricity LCOE) and levelized cost of storage (LCOS) for new resources entering service in 2023dollars per megawatthour Plant type Capacity factor ( percent ) Levelized capital cost Levelized fixed O&M 1 Levelized variable cost Levelized transmis - sion cost Total system LCOE or LCO S Levelized tax credit 2 Total LCOE or LCO S including tax credit Dispatchable technologies Combined cycle 87 % $ 6.80 $ 1.61 $ 25.41 $ 0.96 $ 34.78 NA $ 34.78 Combustion turbine 10 % $ 40.75 $ 8.03 $40.21 $ 8.33 $97.32 N

17 A $97.32 Battery storage 10 %
A $97.32 Battery storage 10 % $ 53.95 $ 28.45 $ 26.56 $ 8.64 $ 117.59 NA $ 117.59 Non - dispatchable technologies Wind, onshore 41 % $ 23.94 $ 7.38 $ 0.00 $ 2.21 $ 33.53 - $ 7.98 $ 25.55 Solar, standalone 3 29 % $ 24.14 $ 6.06 $ 0.00 $ 2.93 $ 33.13 - $ 7.24 $ 25.89 Solar , hybrid 3 , 4 28 % $ 31.95 $ 13.20 $ 0.00 $ 3.02 $ 48.16 - $ 9.58 $ 38.58 Source: U.S. Energy Information Administration, Annual Energy Outlook 2021 O&M = operationsand maintenanceThe tax credit component is based on targeted federal tax credits such as the roduction ax redit (PTC) or nvestment ax redit (ITC) available for some technologies. It reflects tax credits available only forplants entering service in and the substantial phaseout of both the PTC and ITC as scheduled under current law. Technologies not eligible for PTC or ITC are indicated as , or not available. The results are based on a regional model, and state or local incentives are not included in LCOEand LCOScalculations. See text box on page 2 for details on how the tax credits are represented in the model.Technology is assumed to be photovoltaic (PV) with singleaxis tracking. The solar hybrid system is singleaxis PV system coupled with a fourhour battery storage system. Costs are expressed in terms of net ACalternating currentpower available to the grid for the installed capacity. As modeled, EIA assumes that hybrid solar PV generating assets havediurnal storage so that they can be dispatched within a day , but overall operation is limited by resource availabl ility by daytime for hybrid solar PV . ��U.S. Energy Information Administration | Levelized Costof New Generation Resources in the Annual Energy Outlook 2021Table 2. Regional variationin levelized cost of electricity (LCOE) and levelized cost of storage (LCOS) for new resourcesentering service in2020dollars per megawatthour Without tax credits With tax credits 1 Plant type Minimum Simple average Capacity - weighted average 2 Maximum Minimum Simple average Capacity - weighted average 2 Maximum Dispatchable technologies Combined cycle $ 29.17 $ 34.78 $ 33.21 $ 43.47 $ 29.17 $ 34.78 $ 33.21 $ 43.47 Combustion turbine $85.11 $97.32 $97.50 $117.72 $85.11 $97.32 $97.50 $117.72 Battery storage $ 106.63 $ 117.59 $ 121.85 $ 127.64 $ 106.63 $ 117.59 $ 121.85 $ 127.64 Non - dispatchable technologies Wind, onshore $ 25.09 $ 33.53 $ 30.44 $ 56.12 $ 17.10 $ 25.55 $ 22.46 $ 48.14 Solar, standalone 3 $ 27.65 $ 33.13 $ 30.63 $ 44.46 $ 21.61 $ 25.89 $ 23.92 $ 34.49 Solar, hybrid 3 , 4 $ 40.10 $ 48.16 NB $ 62.97 $ 32.19 $ 38.58 NB $ 50.02 Source: U.S. Energy Information Administration, Annual Energy Outlook 2021 Note: EIA calculated the levelized costs for non

18 dispatchable technologies based on the c
dispatchable technologies based on the capacity factor for the marginal site modeled in each region, which can vary significantly by region. The capacity factor ranges for these technologies are 37%51% for onshore wind, 25% 33% for standalone solar PV, and 24%32% for hybrid solar PV. The levelized costs are also affected by regional variations in construction labor rates and capital costs as well as resource availability. 1 Levelized cost with tax credits reflects targeted federal tax credits such as the production tax credit PTCor investment tax c redit ITCavailable for plants entering service in 2023and the substantial phaseoutof both the PTC and ITC as scheduled under current law. 2 The capacityweighted average is the average levelized cost per technology, weighted by the new capacity coming online in each region. The capacity additions for each region are based on additions f rom 2021 to 2023. Technologies for which capacity additions are not expected do not have a capacity weighted average and are marked as or not built 3 Technology is assumed to be photovoltaic (PV) with singleaxis tracking. The solar hybrid system is singleaxis PV system coupled with a fourhour battery storage system. Costs are expressed in terms of net ACalternating currentpower available to the grid for the installed capacity. 4 As modeled, EIA assumes that hybrid solar PV generating assets havediurnal storageso that they can be dispatched within a day , but overall operation is limited by resource availabl ility by daytime for hybrid solar PV . Table A3. Regional variation in levelized avoided cost of electricity LACE) for new resources entering service in 2020dollars per megawatthour Plant type Minimum Simple average Capacity - weighted average 1 Maximum Dispatchable technologies Combined cycle $ 26.72 $ 32.24 $ 31.83 $ 37.34 Combustion turbine $ 50.39 $ 80.84 $ 89.84 $ 120.74 Battery storage $ 50.39 $ 80.84 $ 88.55 $ 120.74 Non - dispatchable technologies Wind, onshore $ 23.07 $ 28.22 $ 27.09 $ 38.98 Solar, standalone 2 $ 23.57 $ 28.78 $ 27.15 $ 37.58 Solar, hybrid 2 , 3 $ 25.23 $ 37.57 NB $ 52.48 Source: U.S. Energy Information Administration, Annual Energy Outlook 2021 The capacityweighted average is the average levelized cost per technology, weighted by the new capacity coming online in each region. The capacity additions for each region are based on additionsfrom2021 to 2023Technologies for which capacity additions are not expected do not have a capacityweighted average and are marked as NBor not builtTechnology is assumed to be photovoltaic(PV)with singleaxis tracking. The solar hybrid system issingleaxis PV system coupled with a fourhour battery storage system. Costs are expressed in terms of net ACalternating currentpower available to the grid for the installed capacity. A

19 s modeled, EIA assumes that hybrid solar
s modeled, EIA assumes that hybrid solar PV generating assets have diurnal storage so that they can be dispatched within a day , but overall operation is limited by resource availabl ility by daytime for hybrid solar PV . ��U.S. Energy Information Administration | Levelized Costof New Generation Resources in the Annual Energy Outlook 2021Table A4a. Valuecost ratio (capacityweighted) for new resources entering service2023 Plant type Average capacity - weightedLCOEor LCOwith tax credits dollars per megawatthour ) Average capacityweightedLACE dollars per megawatthour ) Average value - cost ratio 3 Dispatchable technologies Combined cycle $ 33.21 $ 31.83 0.96 Combustion turbine $97.50 $89.84 0.92 Battery storage $ 121.85 $ 88.55 0.73 Non - dispatchable technologies Wind, onshore $ 22.46 $ 27.09 1.21 Solar , standalone 4 $ 23.92 $ 27.15 1.14 Solar, hybrid 4 , 5 NB NB NB Source: U.S. Energy Information Administration, Annual Energy Outlook 2021 he capacityweighted average is the average levelized cost per technology, weighted by the new capacity coming online in each region. The capacity additions for each region arebased on additionsfrom2021 to 2023Technologies for which capacity additions are not expected do not have a capacityweighted average and are marked as NBor not builtLCOE = levelized cost of electricity, LCOS = levelized cost of storage, and LACE = levelized avoided cost of electricityThe verage valuecost ratio is an average of 25 regional valuecost ratios based on the cost with tax credits for each technology, as available.Technology is assumed to be photovoltaic (PV) with singleaxis tracking. The solar hybrid system is singleaxis PV system coupled with a fourhour battery storage system. Costs are expressed in terms of net ACalternating currentpower available to the grid for the installed capacity. As modeled, EIA assumes that hybrid solar PV generating assets have diurnal storage so that they can be dispatched within a day , but overall operation is limited by resource availabl ility by daytime for hybrid solar PV . Table A4b. Valuecost ratio (unweighted) for new resources entering service in Plant type Average unweighted LCOEor LCO with tax credits dollars per megawatthour ) Average unweightedLACE 1 (2020 dollars per megawatthour ) Average value cost ratio 2 Minimum 3 Maximum 3 Dispatchable technologies Combined cycle $ 34.78 $ 32.24 0.93 0.79 1.04 Combustion turbine $97.32 $ 80.84 0.83 0.53 1.08 Battery storage $ 117.59 $ 80.84 0.69 0.42 0.97 Non - dispatchable technologies Wind, onshore $ 33.53 $ 28.22 1.17 0.74 1.83 Solar, standalone 4 $ 33.13 $ 28.78 1.12 0.97 1.42 Solar , hybrid 4,5 $ 48.16 $ 37.57 0.98 0.73 1.14 Source: U.S. Energy Information

20 Administration, Annual Energy Outlook
Administration, Annual Energy Outlook 2021 LCOE = levelized cost of electricityLCOS = levelized cost of storage, and LACE = levelized avoided cost of electricityThe verage valuecost ratio is an average of 25 regional valuecost ratios based on the cost with tax credits for each technology, as available.The range of unweighted valuecost ratio represents the lower and upper bounds resulting from the ratio of LACELCOEorLACES calculations for each of the 25 regions.Technology is assumed to be photovoltaic (PV) with singleaxis tracking. The solar hybrid system issingleaxis PV system coupled with a fourhour battery storage system. Costs are expressed in terms of net ACalternating currentpower available to the grid for the installed capacity. As modeled, EIA assumes that hybrid solar PV generating assets have diurnal storageso that they can be dispatched within a day , but overall operation is limited by resource availabl ility by daytime for hybrid solar PV . ��U.S. Energy Information Administration | Levelized Costof New Generation Resources in the Annual Energy Outlook 2021 AppendixLCOE and LACE tables for new resources entering service in 2040 Table B1a. Estimated capacityweightedlevelized cost of electricity (LCOE) and levelized cost of storage (LCOS) for new resources entering service in 2040 (2020dollars per megawatthour Plant type Capacity factor ( percent ) Levelized capital cost Levelized fixed O&M 2 Levelized variable cost Levelized transmis - sion cost Total system LCOE or LCO S Levelized tax credit 3 Total LCOE or LCO S including tax credit Dispatchable technologies Ultra - supercritical coal NB NB NB NB NB NB NB NB Combined cycle 87 % $ 6.95 $ 1.61 $ 26.79 $ 0.98 $ 36.33 NA $ 36.33 Combustion turbine 10% $42.15 $8.03 $51.28 $9.70 $111.16 NA $111.16 Advanced nuclear NB NB NB NB NB NB NB NB Geothermal 90 % $ 19.73 $ 15.02 $ 1.17 $ 1.34 $ 37.26 - $ 1.97 $ 35.29 Biomass NB NB NB NB NB NB NB NB Battery storage 10 % $ 51.02 $ 28.44 $ 12.56 $ 12.12 $ 104.14 NA $ 104.14 Non - dispatchable technologies Wind, onshore 40% $20.18 $7.54 $0.00 $3.04 $30.76 NA $30.76 Wind, offshore NB NB NB NB NB NB NB NB Solar, standalone 4 28 % $ 20.61 $ 6.21 $ 0.00 $ 2.90 $ 29.72 - $ 2.06 $ 27.66 Solar, hybrid 4 , 5 30 % $ 24.53 $ 12.52 $ 0.00 $ 2.91 $ 39.95 - $ 2.45 $ 37.50 Hydroelectric 5 NB NB NB NB NB NB NB NB Source: U.S. Energy Information Administration, Annual Energy Outlook 2021 1 The capacityweighted average is the average levelized cost per technology, weighted by the new capacity coming online in each region. The capacity additions for each region are based on additions fromto 2040. Technolog

21 ies for which capacity addition s are n
ies for which capacity addition s are not expected do not have a capacityweighted average and are marked as or not built 2 O&M = operationand maintenance 3 The tax credit component is based on targeted federal tax credits such as the roduction ax redit (PTC) or nvestment ax C redit (ITC) available for some technologies. It reflects tax credits available only for plants entering service in 2040 and the substantial phaseout of both the PTC and ITC as scheduled under current law. Technologies not eligible for PTC or ITC are indica ted as , or not available. The results are based on a regional model, and state or local incentives are not included in LCOE and LCOcalculations. See text box on page 2 for details on how the tax credits are represented in the model. 4 Technology is assumed to be photovoltaic(PV)with singleaxis tracking. The solar hybrid system is singleaxis PV system coupled with a fourhour battery storage system. Costs are expressed in terms of net ACalternating currentpower available to the grid for the ins talled capacity. 5 As modeled, EIA assumes that hydroelectric and hybrid solar PV generating assets have seasonal and diurnal storage respectively, so that they can be dispatched within a seasonor a day, but overall operation is limited by resource availablility by site and season for hydroelectric and by daytime for hybrid solar PV . ��U.S. Energy Information Administration | Levelized Costof New Generation Resources in the Annual Energy Outlook 2021Table B1b. Estimated unweighted levelized cost of electricity (LCOE) and levelized cost of storage (LCOS) for new resources entering service in 2040 (dollars per megawatthour Plant type Capacity factor ( percent ) Levelized capital cost Levelized fixed O&M 1 Levelized variable cost Levelized transmis - sion cost Total system LCOE or LCO S Levelized tax credit 2 Total LCOE or LCO S including tax credit Dispatchable technologies Ultra - supercritical coal 85 % $ 41.95 $ 5.48 $ 22.75 $ 1.08 $ 71.26 NA $ 71.26 Combined cycle 87 % $ 7.80 $ 1.61 $ 31.26 $ 1.10 $ 41.77 NA $ 41.77 Combustion turbine 10 % $ 43.69 $ 8.03 $50.70 $ 9.54 $111.97 NA $111.97 Advanced nuclear 90 % $ 48.93 $ 15.51 $ 2.38 $ 1.04 $ 67.87 - $ 5.00 $ 62.87 Geothermal 90 % $ 19.49 $ 15.78 $ 1.17 $ 1.34 $ 37.78 - $ 1.95 $ 35.83 Biomass 83 % $ 32.32 $ 17.38 $ 35.84 $ 1.15 $ 86.69 NA $ 86.69 Battery storage 10 % $ 49.67 $ 28.44 $ 23.39 $ 9.69 $ 110.26 NA $ 110.26 Non - dispatchable technologies Wind, onshore 41 % $ 25.96 $ 7.46 $ 0.00 $ 2.57 $ 35.98 NA $ 35.98 Wind, offshore 43 % $ 58.94 $ 29.36 $ 0.00 $ 2.52 $ 90.82 NA $ 90.82 Solar , standalone 3 29 % $ 20.38 $ 6.12 $ 0.00 $ 3.39 $ 29.89 - $ 2.04 $ 27.8

22 5 Solar, hybrid 3,4 28 % $ 26.83
5 Solar, hybrid 3,4 28 % $ 26.83 $ 13.36 $ 0.00 $ 3.51 $ 43.70 - $ 2.68 $ 41.02 Hydroelectric 4 54 % $ 39.38 $ 11.05 $ 3.97 $ 2.01 $ 56.40 NA $ 56.40 Source: U.S. Energy Information Administration, Annual Energy Outlook 2021 O&M = operations and maintenanceThe tax credit component is based on targeted federal tax credits such as the roduction ax redit (PTC) or nvestment ax redit (ITC) available for some technologies. It reflects tax credits available only for plants entering service in 2040 and the substantial phaseout of both the PTC and ITC as scheduled under current law. Technologies not eligible for PTC or ITC are indicated as , or not available. The results are based on a regional model, and state or local incentives are not included in LCOEand calculations. See text box on page 2 for details on how the tax credits are represented in the model.Technology is assumed to be photovoltaic (PV) with singleaxis tracking. The solar hybrid system is singleaxis PV system coupled with a fourhourbattery storage system. Costs are expressed in terms of net ACalternating currentpower available to the grid for the installed capacity. As modeled, EIA assumes that hydroelectric and hybrid solar PV generating assets have seasonal and diurnal storagrespectively,so that they can be dispatched within a seasonor a day, but overall operation is limited by resource availablility by site and season for hydroelectric and by daytime for hybrid solar PV . ��U.S. Energy Information Administration | Levelized Costof New Generation Resources in the Annual Energy Outlook 2021Table B2. Regional variation in levelized cost of electricity (LCOE) and levelized cost of storage (LCOSfor new resources entering service in 2040 (2020dollars per megawatthour Without tax credits With tax credits 1 Plant type Minimum Simple average Capacity - weighted average 2 Maximum Minimum Simple average Capacity - weighted average 2 Maximum Dispatchable technologies Ultra - supercritical coal $ 63.58 $ 71.26 NB $ 86.66 $ 63.58 $ 71.26 NB $ 86.66 Combined cycle $ 33.15 $ 41.77 $ 36.33 $ 70.53 $ 33.15 $ 41.77 $ 36.33 $ 70.53 C ombustion turbine $97.11 $111.97 $111.16 $159.90 $97.11 $111.97 $111.16 $159.90 Advanced nuclear $ 63.42 $ 67.87 NB $ 76.34 $ 58.43 $ 62.87 NB $ 71.34 Geothermal $ 30.68 $ 37.78 $ 37.26 $ 43.30 $ 29.32 $ 35.83 $ 30.76 $ 40.94 Biomass $ 79.61 $ 86.69 NB $ 128.72 $ 79.61 $ 86.69 NB $ 128.72 Battery storage $ 90.70 $ 110.26 $ 104.14 $ 121.90 $ 90.70 $ 110.26 $ 104.14 $ 121.90 Non - dispatchable technologies Wind, onshore $ 25.63 $ 35.98 $ 30.76 $ 55.14 $ 25.63 $ 35.98 $ 30.76 $ 55.14 Wind, offshore $ 74.16 $ 90.82 NB $ 108.41 $ 74.16 $ 90.82 NB $ 108.41 Solar, stan

23 dalone 3 $ 24.67 $ 29.89 $ 29.72
dalone 3 $ 24.67 $ 29.89 $ 29.72 $ 39.64 $ 22.99 $ 27.85 $ 27.66 $ 36.86 Solar, hybrid 3,4 $ 35.94 $ 43.70 $ 39.95 $ 56.26 $ 33.75 $ 41.02 $ 37.50 $ 52.68 Hydroelectric 4 $ 35.94 $ 43.70 NB $ 56.26 $ 33.75 $ 41.02 NB $ 52.68 Source: U.S. Energy Information Administration, Annual Energy Outlook 2021 Note: EIA calculated the levelized costs for non dispatchable technologies based on the capacity factor for the marginal site modeled in each region, which can vary significantly by region. The capacity factor ranges for these technologies are 38%48% for onshore wind, 41% 50% for offshore wind, 25%33% for standalone solar PV, 24%32% for hybrid solar PV, and 25%80% for hydroelectric. The levelized costs are also affected by region al variations in construction labor rates and capital costs as well as resource availability. 1 Levelized cost with tax credits reflects targeted federal tax credits such as the production tax credit PTCor investment tax c redit ITCavailable for plants entering service in 2023 and the substantial phaseout of both the PTC and ITC as scheduled under current law. 2 The capacityweighted average is the average levelized cost per technology, weighted by the new capacity coming online in ea ch region. The capacity additions for each region are based on additions from to 2040. Technologies for which capacity additions are not expected do not have a capacity weighted average and are marked as or not built 3 Technology is assumed to be photovoltaic(PV)with singleaxis tracking. The solar hybrid system issingleaxis PV system coupled with a fourhour battery storage system. Costs are expressed in terms of net ACalternating currentpower available to the grid for the installed capa city. 4 As modeled, EIA assumes that hydroelectric and hybrid solar PV generating assets have seasonal and diurnal storage respectively, so that they can be dispatched within a seasonor a day, but overall operation is limited by resource availablility by site and season for hydroelectric and by daytime for hybrid solar PV . ��U.S. Energy Information Administration | Levelized Costof New Generation Resources in the Annual Energy Outlook 2021Table B3. Regional variation in levelized avoided cost of electricity LACE) for new resources entering service in 2040 (2020dollars per megawatthour Plant type Minimum Simple average Capacity - weighted average 1 Maximum Dispatchable technologies Ultra - supercritical coal $ 33.60 $ 37.35 NB $ 43.07 Combined cycle $ 33.43 $ 38.05 $ 36.29 $ 48.01 Combined turbine $ 65.22 $ 87.03 $ 90.23 $ 117.32 Advanced nuclear $ 33.50 $ 37.22 NB $ 42.96 Geothermal $ 38.55 $ 43.10 $ 43.23 $ 47.55 Biomass $ 33.74 $ 38.28 NB $ 48.15 Battery storage $ 65.22 $ 87.03 $ 68.50 $ 117.32 Non - dispatc

24 hable technologies Win
hable technologies Wind, onshore $ 27.89 $ 33.66 $ 32.68 $ 51.99 Wind, offshore $ 29.53 $ 34.25 NB $ 45.23 Solar, standalone 2 $ 25.96 $ 29.69 $ 30.12 $ 35.52 Solar, hybrid 2,3 $ 34.42 $ 43.66 $ 41.18 $ 53.62 Hydroelectric 3 $ 30.25 $ 36.56 NB $ 46.15 Source: U.S. Energy Information Administration, Annual Energy Outlook 2021 The capacityweighted average is the average levelized cost per technology, weighted by the new capacity coming online in each region. The capacity additions for each region are based on additions fromto 2040. Technologies for which capacity additions are not expected do not have a capacityweighted average and are marked as NBor not builtTechnology is assumed to be photovoltaic (PV) with singleaxis tracking. The solar hybrid system issingleaxis PV system coupled with a fourhour battery storage system. Costs are expressed in terms of net ACalternating currentpower available to the grid for the installed capacity. As modeled, EIA assumes that hydroelectric and hybrid solar PV generating assets have seasonal and diurnal toragerespectively,so that they can be dispatched within a seasonor a day, but overall operation is limited by resource availablility by site and season for hydroelectric and by daytime for hybrid solar PV . ��U.S. Energy Information Administration | Levelized Costof New Generation Resources in the Annual Energy Outlook 2021Table B4a. Valuecost ratio (capacityweighted) for new resources entering service in 2040 Plant type Average capacity - weightedLCOEor LCOSwith tax credits dollars per megawatthour ) Average capacityweightedLACE dollars per megawatthour ) Average value - cost ratio 3 Dispatchable technologies Ultra - supercritical coal NB NB NB Combined cycle $ 36.33 $ 36.29 1.00 Combustion turbine $111.16 $90.23 0.81 Advanced nuclear NB NB NB Geothermal $ 35.29 $ 43.23 1.24 Biomass NB NB NB Battery storage $ 104.14 $ 68.50 0.66 Non - dispatchable technologies Wind, onshore $ 30.76 $ 32.68 1.06 Wind, offshore NB NB NB Solar , standalone 4 $ 27.66 $ 30.12 1.09 Solar, hybrid 4,5 $ 37.50 $ 41.18 1.10 Hydroelectric 5 NB NB NB Source: U.S. Energy Information Administration, Annual Energy Outlook 2021 he capacityweighted average is the average levelized cost per technology, weighted by the new capacity coming online in each region. The capacity additions for each region are based on additions fromto 2040. Technologies for which capacity additions are not expected do not have a capacityweighted average and are marked as NBor not builtLCOE = levelized cost of electricityLCOS = levelized cost of storage, and LACE = levelized avoided cost of electricityThe verage valuecost ratio is an average of 25 regional valuecost ratios based on the cost with tax credi

25 ts for each technology, as available.Tec
ts for each technology, as available.Technology is assumed to be photovoltaic (PV) with singleaxis tracking. The solar hybrid system is singleaxis PV system coupled with a fourhour battery storage system. Costs are expressed in terms of net ACalternating currentpower available to the grid for the installed capacity. As modeled, EIA assumes that hydroelectric and hybrid solar PV generating assets have seasonal and diurnal storagerespectively,so that they can be dispatched within a seasonor a day, but overall operation is limited by resource availablility by site and season for hydroelectric and by daytime f or hybrid solar PV . ��U.S. Energy Information Administration | Levelized Costof New Generation Resources in the Annual Energy Outlook 2021Table B4b. Valuecost ratio (unweighted) for new resources entering service in 2040 Plant type Average unweighted LCOEor LCO with tax credits dollars per megawatthour ) Average unweighted LACE 1 (2020 dollars per megawatthour ) Average value cost ratio 2 Minimum 3 Maximum 3 Dispatchable technologies Ultra - supercritical coal $ 71.26 $ 37.35 0.53 0.44 0.61 Combined cycle $ 41.77 $ 38.05 0.93 0.67 1.01 Combustion turbine $111.97 $87.03 0.78 0.41 0.99 Advanced nuclear $ 67.87 $ 37.22 0.59 0.52 0.72 Geothermal $ 37.78 $ 43.10 1.23 1.00 1.62 Biomass $ 86.69 $ 38.28 0.44 0.30 0.52 Battery storage $ 110.26 $ 87.03 0.79 0.61 1.13 Non - dispatchable technologies Wind, onshore $ 35.98 $ 33.66 0.95 0.67 1.13 Wind, offshore $ 90.82 $ 34.25 0.38 0.29 0.49 Solar , standalone 4 $ 29.89 $ 29.69 1.07 0.88 1.19 Solar, hybrid 4,5 $ 43.70 $ 43.66 1.07 0.91 1.21 Hydroelectric 5 $ 56.40 $ 36.56 0.66 0.51 0.86 Source: U.S. Energy Information Administration, Annual Energy Outlook 2021 LCOE = levelizedcost of electricityLCOS = levelized cost of storage, and LACE = levelized avoided cost of electricityThe verage valuecost ratio is an average of 25 regional valuecost ratios based on the cost with tax credits for each technology, as available.Theange of unweighted valuecost ratio represents the lower and upper boundresulting from the ratio of LACELCOEor LACELCOScalculations for each of the 2regions.Technology is assumed to be photovoltaic (PV) with singleaxis tracking. The solar hybrid system is singleaxis PV system coupled with a fourhour battery storage system. Costs are expressed in terms of net ACalternating currentpower available to the grid for the installed capacity. As modeled, EIA assumes that hydroelectric andhybrid solar PV generating assets have seasonal and diurnal storagerespectively,so that they can be dispatched within a seasonor a day, but overall operation is limited by resource availablilityby site and season for hydroelectric and by daytime for hybrid sol