/
Lake Travis Drought Katie Born Lake Travis Drought Katie Born

Lake Travis Drought Katie Born - PowerPoint Presentation

spottletoefacebook
spottletoefacebook . @spottletoefacebook
Follow
342 views
Uploaded On 2020-06-25

Lake Travis Drought Katie Born - PPT Presentation

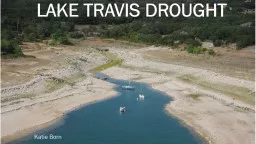
Goal Map the drought severity in the AustinLake Travis Lakes Subbasin against the elevation of the Lake Travis reservoir Lake Travis Reservoir created in 1942 with the construction of Mansfield Dam by the Lower Colorado ID: 787203

lake travis reservoir drought travis lake drought reservoir data 2011 lakes subbasin austin droughts 2015 2005 msl control 2008

Share:

Link:

Embed:

Download Presentation from below link

Download The PPT/PDF document "Lake Travis Drought Katie Born" is the property of its rightful owner. Permission is granted to download and print the materials on this web site for personal, non-commercial use only, and to display it on your personal computer provided you do not modify the materials and that you retain all copyright notices contained in the materials. By downloading content from our website, you accept the terms of this agreement.


Presentation Transcript

Slide1

Lake Travis Drought

Katie Born

Slide2

Goal

Map the drought severity in the Austin-Lake Travis Lakes Subbasin against the elevation of the Lake Travis reservoir

Slide3

Lake Travis

Reservoir created in 1942 with the construction of Mansfield Dam by the Lower Colorado River Authority

Full

at elevation of 681.1

msl

→ 382,092,882,600 gallons of water

Historically lowest level of

614.2

msl

on August 14,

1951

Water

supply for Austin and surrounding areas

Lake

Travis is the primary flood control reservoir for the Highland Lakes Chain

40% of the lake’s 1,950,000 acre-

ft

capacity is reserved for flood control

Slide4

Slide5

Texas Droughts

1940s – 1950s1963 - 1964

1983 - 1984

1999 – 2000

2005 – 2006

2007 - 2009

2008 – 2015

1952

(

Mashhood

, 2011)

Slide6

Texas Droughts

1940s – 1950s1963 - 1964

1983 - 1984

1999 – 2000

2005 – 2006

2007 - 2009

2008 – 2015

2011

(

Mashhood

, 2011)

Slide7

Why Droughts?

Reservoir levelsWildfiresCrops

Electricity production

Groundwater

Slide8

Drought Data

Slide9

Dealing with Data

Cut to subbasin

Adding time field to data from file name

Compiling all data into one file

THANK YOU Gonzalo Espinoza!

Slide10

Drought in the Austin-Lake Travis Lakes Subbasin (2005 – 2015)

Slide11

Future Work

Add the reservoir level data for Lake Travis to the current drought map