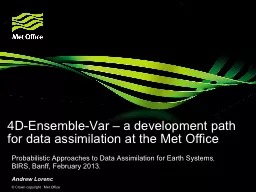
GODEXNWP 2017 Nigel Atkinson Met Office 16 th 19 th May 2017 Lannion France Contents NWP model and infrastructure capabilities Changes in data usage since last GODEXNWP focussing on satellite data ID: 760564
Download Presentation The PPT/PDF document "© Crown copyright Met Office" is the property of its rightful owner. Permission is granted to download and print the materials on this web site for personal, non-commercial use only, and to display it on your personal computer provided you do not modify the materials and that you retain all copyright notices contained in the materials. By downloading content from our website, you accept the terms of this agreement.
Slide1
© Crown copyright Met Office
GODEX-NWP 2017
Nigel Atkinson,
Met Office
16
th
– 19
th
May 2017,
Lannion
, France
Slide2Contents
NWP model and infrastructure capabilitiesChanges in data usage since last GODEX-NWP (focussing on satellite data)Report from RTH ExeterWMO matters
© Crown copyright Met Office
Slide3Forecasting Process
Observations
Regional 4km
Global 17km
UK 1.5km
+Regional ensemble
+Global ensemble
+UK ensemble
Slide4Supercomputer
Old
Systems in 3 computer halls (two at HQ and one in new building in Exeter Science Park)
Cost £97m
Delivered on time
Parallel Suite 37 was successfully implemented on 15th March 2016Hall 3 system completed spring 2017
Hall 3
Slide5FSOI (operations, Sept 2016)“Forecast sensitivity to observation impact”= reduction in 24h forecast error due to each ob-type
New
obs added in 2016
*
= non-satellite obs
*
*
*
*
*
*
*
*
*
*
*
Impact of satellite obs ≈75% of total impact
Slide6Satellite data used in NWP
Through data assimilation:
satellite sounder radiances -
3D temperature and humidity
AMVs
, atmospheric motion vectors
- geo and
leo
- winds
geo imager clear sky radiances -
humidity
scatterometer
– ocean surface wind vector
passive MW imagery
– ocean surface wind speed
GPS - radio occultation -
bending angles
density profile
GPS – total zenith delay
- total column water vapour
geo imagery
- cloud height and amount (UKV)
Also, various satellite data types for:
sea surface temperature
soil moisture
sea ice
snow cover
Slide7AIRS
ATOVS=
AMSUA + MHS
IASI
Satellite radiance data used pre-2016
in a 6h assimilation window
ATMS
CrIS
Slide8AIRS
AMSR-2
ATMS
ATOVS=
AMSUA + MHS
CrIS
IASI
MT-Saphir
MWHS-2
SSMIS
Satellite radiance data - updates post-PS37
in a 6h assimilation window
Slide9NWP Performance:Global upgrades 2015-16
PS35
(Feb 2015)
+0.9 (obs)
PS37(Mar 2016)+2.4 (obs) / +2.3 (anl)
PS38(Nov 2016)+1.0 (obs) / +1.6 (anl)
Improved RO operator Correlated R for AIRS CrIS over land Improved radiance QC
VarBC Correlated R for CrIS SSMIS AMSR-2 FY-3C MWHS-2 M-T Saphir CVT
AIRS / CrIS (IR) dynamic land ɛ AMSU-A (MW) dynamic land ɛ Improved AMV QC VIIRS winds Himawari-8 Humidity radiance R-retune FY-3B MWHS-1
Slide10Spring 2017 – global model resolution upgrade
Slide11PS39 (June 2017): Global 10km Model (N1280)
Summer trial: +0.55 (obs), +0.59 (anal), +1.76% (UK Index) Winter trial: +1.00 (obs), +1.45 (anal), +1.54% (UK Index): Planning for June 2017 operational implementation.
Winter Verification Vs
Obs
Winter
Verif Vs Analysis
Slide12PS39 EPS CRPS scorecard for winter 2016 – up is better (max
triangle = 20% improvement)
PS39: Global 20km Ensemble (N640)
Improved spread, lower ensemble mean RMSE, improved probabilistic scores (CRPS +3.5%)
Improved ensemble skill can help provide better guidance for the probability of high-impact weather events such as a storm strike
Slide13PS39 UK model: Hourly 4DVar vs 3Hourly 3DVar, ‘Nowcasting’ Performance
VariableSummerWinterScreen temperature-12.4%+0.9%Screen relative humidity-2.9%-6.0%Screen log10 visibility-2.4%-4.0%10-metre vector wind-3.1%-4.7%pmsl-3.2%-10.0%Total cloud cover+3.8%-2.1%
(Average of t+2 & t+8 rms errors for hourly 4DVAR – Average of t+4 & t+10 rms errors for 3-hourly 3DVAR) / Average of t+4 & t+10 rms errors for 3-hourly 3DVAR
Note:
VarBC
is used
Slide14SINGV Project: Year 4
SINGV 1.5km EPS: Hovmoller Plot:
Implemented real-time DA and ensemble in Singapore
1
st version of hourly 4DVar tested Timely data over Singapore region is critical (making use of DBNet)
GPM:
VN4.0
VN4.1
VN3.1
Slide15Future satellites of particular interest
GOES-16
Now on
EUMETCast
(May 2017)
ADM-Aeolus
FY-4A
GIIRS (
hyperspectral
sounder) of particular interest –
useful preparation for MTG-IRS
SRFs needed for GIIRS and AGRI
JPSS-1
– SRFs needed for VIIRS
FY-3D
and 3E
Metop-SG-A1
(2021) and B1 (2022)
MTG-I1 (2021) and S1 (2022)
Slide16Where do we get meteorological data from?
EUMETCast
EUMETSAT
GTS
(national met. services)
NESDIS link
Satellite agencies e.g. NASA, ESA
Met Office
Satellite direct broadcast
Others
e.g. research organisations
Slide17What level of data do we need to handle?
Raw bit stream (e.g. direct broadcast)Level 1b – raw counts with calibration coefsLevel 1c – brightness temperature, on original measurement gridLevel 1.5 – MSG channel dataLevel 2 – meteorological products (e.g. SST), on original measurement gridLevel 3 – gridded products
Formats?
Bespoke binary
BUFR and GRIB
NetCDF4 / hdf5
NetCDF3
hdf-eos
HRIT (for MSG)
Others ….
Slide18Direct broadcast reception
Still using two Spacetec (MEOS) systems on site at ExeterNOAA-15/18/19, S-NPP, Metop-A/B, Terra, Aqua, FY-3A/3B/3CSoon: JPSS-1, FY-3DFY-3E is t.b.d. (polarisation issue)Processing packages:AAPP (NWP SAF)CSPP (UW/NOAA)FY3L0pp / FY3L1ppIncluding MWRI capability introduced in April 2016
3.2m
Yentai
2.4m Orbital
Slide19Storage in MetDB
Recently acquired 32TB disk, to ensure that most of this data is available on-line, reducing retrievals from MASS tape
Slide20Relative volumes from different sources
Slide21EUMETCast reception
Hyperspectral
IR is the largest, though most of it is not stored (we use spectral and spatial thinning)
Slide22The challenge of data volume
We are here
Massive increase from 2021 - be prepared!
Be selective over what we really need
Data
transmitted
on EUMETCast
600GB/day
Chart from EUMETSAT
Slide23NESDIS link
The Met Office still operates a direct link to NOAA/NESDIS
It has proved valuable on the rare occasions when NOAA internet links have been lost (e.g. in 2014)
Carries some data types that are not available by other means, including:
Aqua AIRS and AMSU-A global data (BUFR)
SSMIS UPP data (BUFR)
ATOVS level 1b (native format – useful for monitoring)
GOES CSR
We are considering whether a commercial link is still required, or whether we can rely on internet or some other solution
How robust is EUMETSAT’s link to NESDIS?
Slide24Report from RTH Exeter
© Crown copyright Met Office
Slide25© Crown copyright Met Office
RTH Exeter GTS connectivity
Connections to RTHs:
Brasilia, Melbourne, Moscow,
New Delhi
, Offenbach,
Pretoria,
Rome, Tokyo,
Toulouse
, Washington
Connections to NMCs:
Brussels, Copenhagen, Dar es Salaam, De Bilt, Dublin,
Lisbon, Madrid, Montreal, Oslo, Reykjavik
Daily traffic:
Input 17 GBytes per day
Output 40 GBytes per day
99.98% availability between April 2015 and March 2017.
Slide26© Crown copyright Met Office
GISC Exeter WIS connectivity
Daily traffic statistics:
Ingesting 7.4GBytes of data into 24hr Cache.
Metadata catalog contains 155,000 records.
Daily catalog synchronisation with GISCs & DCPCs
:
Beijing, Brasilia, ECMWF, Jeddah, Melbourne,
Moscow,
Offenbach,
Seoul, Tehran,
Tokyo
, Toulouse
97.59% availability between April 2015 and March 2017.
Data replication between 15 GISC’s may saturate network bandwidth.
Pilot project underway to test potential for cloud solution. Running for 18 months
Slide27© Crown copyright Met Office
Data migration away from traditional alphanumeric codes (TAC)
The Met Office has ceased to distribute land & SHIP SYNOP, CLIMAT and AMDAR data in TAC format, replacing them with BUFR format data.
So far, very few centres have ceased transmission of TAC format data. The main issues are:
Variable quality of conversion applications being used.
Differing interpretations of the various BUFR templates.
Poorly converted locations information.
Lack of funding to perform ‘grass roots’ data migration activity.
The Met Office is:
Contacting all recipients of TAC form data, to determine the impact of the change.
Providing links to a number of available converters that customers can use to convert TDCF data back to TAC.
The next conversion project is now underway, migrating aviation OPMET data to XML format – iWXXM.
Unlike TAC to BUFR, all non-Met Office OPMET data converted from XML back to TAC cannot be distributed outside of the organisation.
Stricter control on data will place onus on users of the OPMET data to migrate to using the XML formats.
Slide28© Crown copyright Met Office
Present Data types on NESDIS Link
Data Type
Platform
File header
MB /day
Files
AMSU-A Level 1B
NOAA-ATOVS
nss.amax
137
85
AMSU-B Level 1B
NOAA-ATOVS
nss.ambx
97
14
HIRS Level 1B
NOAA-ATOVS
nss.hirx
308
85
MHS Microwave Humidity Sounder
NOAA-ATOVS
nss.mhsx
395
71
HIRS Level 1B (AVHRR mapped to HIRS grid)
NOAA-ATOVS
npr.atav
118
57
AIRS Brightness temperatures
NASA –EOS-2 (Aqua)
npr.aibt
166
242
AMSU-A Brightness temperatures
NASA –EOS-2 (Aqua)
npr.aubt
9
232
SSM/I Brightness temperatures
DSMP
npr.sdrr
72
14
SSMIS Level 1C
DSMP
npr.td{E,I,L,U}b
900
208
SSMIS UPP
DSMP
npr.tdup
318
35
Ozone, retrieved profiles and/or total column from SBUV
DSMP
prd.ozone.pmf
3
14
WindSat
NPR_E068.WS
0
0
COSMIC
bfrPrf_C00{1,2,4,5,6}
2
185
CSBT
T_JUTX
66
47
Total
(wef 20 April 2017)
2591
1289
Slide29© Crown copyright Met Office
Present Data Volumes NESDIS Link
Slide30WMO matters
© Crown copyright Met Office
Slide31WMO codes registry
(information from Mark Hedley)
http://codes.wmo.int
“The primary purpose of this Service is to support the new data exchange standard developed by WMO in support of Amendment 76 to ICAO Annex 3 "Meteorological Services for International Air Navigation”
The Met Office operates this Service on behalf of
WMO.
Slide32WIGOS Station identifiers (information from Richard Weedon)
The WMO IPET-DRC (
Inter-Programme Team on Data Representation and Codes
) discussed the extension of the current system of station Identification in 2011.
In 2014 the ICG-WIGOS group reviewed and agreed upon the structure of the new identifier.
It was agreed at this time that the new system of identification would be restricted to table Driven Code Forms (BUFR
& CREX). Representation of the new identifier within TAC would not be possible.
In the same year the IPET-DRMM were invited to construct new entries in TDCF tables B and D to represent the new structure .
Slide33Assignment of a WIGOS ID
It’s complicated – lots of issues to be worked out
OSCAR/Surface needs to be used to identify stationsBUFR sequence 3-01-150 added to start of the sequence contains the identifierSurface observations from existing WWW stations may or may not include the new identifiers
Examples:
Exeter airport =
0-20000-0-03839
Ship 9631369 =
0-20007-0-9631369
Jungfraujoch
(JFJ) =
0-20008-0-JFJ
METEOSAT-10 (ID=57) =
0-20009-0-057
Slide34WIGOS ID - conclusions
The development of the WIGOS identification system, is still in its early stages. Its successful completion is dependent on the construction of national practices to govern the issuing of the ID’s.
The new system has a heavy reliance on OSCAR as a source of reference, which currently has a limited interface.
Not all data producers are in a position to produce BUFR for onwards transmission. This has placed a heavy workload on the regional centres and RTH’s who are expected to provide TAC to BUFR conversion
Data producers must agree upon a national practice which links the standard identification system with that used by the centre responsible for the conversion of the data to TDCF
© Crown copyright Met Office
Thank you!
Questions?