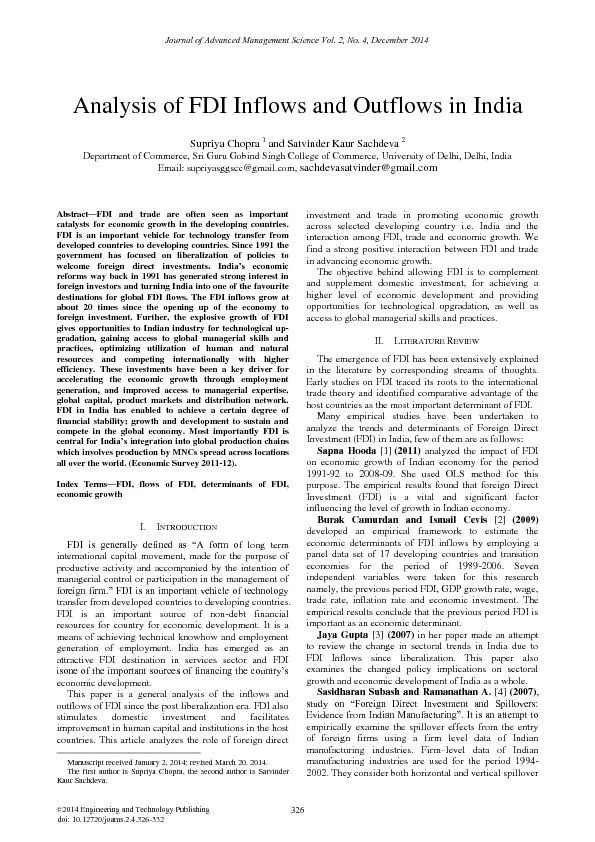
326 Journal Manuscript received January 2 2014 revised March 20 2014 The first author is Supriya Chopra the second author is Satvinder Kaur Sachdeva investment and trade in promoting economic g ID: 390034
Download Pdf The PPT/PDF document "of Advanced Management Science Vol. 2, N..." is the property of its rightful owner. Permission is granted to download and print the materials on this web site for personal, non-commercial use only, and to display it on your personal computer provided you do not modify the materials and that you retain all copyright notices contained in the materials. By downloading content from our website, you accept the terms of this agreement.
326 Journal of Advanced Management Science Vol. 2, No. 4, December 2014©2014 Engineering and Technology Publishingdoi: 10.12720/joams.2.4.326-332Analysis of FDI Inflows and Outflows in India Supriya Chopra 1 and Satvinder Kaur Sachdeva 2 Department of Commerce, Sri Guru Gobind Singh College of Commerce, University of Delhi, Delhi, India Email: supriyasggscc@gmail.com, sachdevasatvinder@gmail.com Abstract ²FDI and trade are often seen as important Manuscript received January 2, 2014; revised March 20, 2014. The first author is Supriya Chopra, the second author is Satvinder Kaur Sachdeva. investment and trade in promoting economic growth across selected developing country i.e. India and the interaction among FDI, trade and economic growth. We find a strong positive interaction between FDI and trade in advancing economic growth. The objective behind allowing FDI is to complement and supplement domestic investment, for achieving a higher level of economic development and providing opportunities for technological upgradation, as well as 327 Journal of Advanced Management Science Vol. 2, No. 4, December 2014©2014 Engineering and Technology Publishingeffects of FDI. Consistent with the results of the previous studies, the study finds no evidence of horizontal spillover effects. However, the study finds negative vertical spillover effects. AnandVirmani and Susan Collins [5] (2007) studied H P S L U L F D O O \ , Q G L D ¶ V H F R Q R P L F J U R Z W K H [ S H U L H Q F H G X U L Q J 1960-2004 focussing on the post 1973 acceleration. The D Q D O \ V L V I R F X V H V R Q W K H X Q X V X D O G L P H Q V L R Q V R I , Q G L D ¶ V experience. They find that India will need to broaden its current expansion to provide manufactured goods to the world market and jobs for its large pool of low skilled workers. Balasubramanyam V. N Sapsford David [6] (2007) L Q W K H L U D U W L F O H ³ ' R H V , Q G L D Q H H G D O R W P R U H ) ' , ´ compares the levels of FDI inflows in India and China, and found that FDI in India is one tenth of that of china. The paper also finds that India may not require increased ) ' , E H F D X V H R I W K H V W U X F W X U H D Q G F R P S R V L W L R Q R I , Q G L D ¶ V manufacturing, service sectors and her endowments of human capital. The requirements of managerial and organizational skills of these industries are much lower than that of labour intensive industries such as those in China. Also, India has a large pool of well ± Trained engineers and scientists capable of adapting and restructuring imported know ± how to suit local factor and product market condition all of these factors promote effective spillovers of technology and know- how from foreign firms to locally own firms. Garrick Blalock [7] (2006) L Q K L V Z R U N ³ 7 H F K Q Rlogy adoption from Foreign Direct Investment and Exploring: ( Y L G H Q F H I U R P , Q G R Q H V L D Q 0 D Q X I D F W X U L Q J ´ F R Q W D L Q V W K U H H essays on technology adoption from foreign direct investment and exploring. The first essay investigates how technology that accompanies FDI diffuses in the host economy and finds that multinationals wish to limit technology leakage to domestic rivals, they benefits from deliberate technology transfer to suppliers that may lower input prices or raise input quality. Nirupam Bajpai and Jeffrey D. Sachs [8] (2006) in W K H L U S D S H U ³ ) R U H L J Q ' L U H F W , Q Y H V W P H Q W L Q , Q G L D , V V X H V D Q G 3 U R E O H P V ´ D W W H P S W H G W R L G H Q W L I \ W K H L V V X H V D Q G S U R E O H P V D V V R F L D W H G Z L W K , Q G L D ¶ V F X U U H Q W ) ' , U H J L P H V and more importantly the other associated factors U H V S R Q V L E O H I R U , Q G L D ¶ V unattractiveness as an investment location. The conclusion of the study is that a restricted FDI regime, high import tariffs, exit barriers for firms, stringent labor laws, poor quality infrastructure, centralized decision making processes, and a very limited scale of export processing zones make India an unattractive investment location. Kulwinder Singh [9] (2005) has analyzed FDI flows from 1991-2005. A sectoral analysis in his study reveals that while FDI shows a gradual increase has become a staple of success in India, the progress is hollow. The telecommunication and power sector are the reasons for the success of infrastructure. He finds that in the comparative studies the notion of infrastructure has gone a definitional change. FDI in sectors is held up primarily by telecommunication and power is not evenly distributed. Nagesh Kumar [10] (2001) analyses the role of infrastructure availability in determining the attractiveness of countries for FDI inflows for export orientation of MNC production. It is therefore topical to get an insight into the effect of FDI outflows into corresponding inflows. Recent empirical works have tried to establish the determination of FDI inflows by considering economic growth, export, import, labor productivity, or a combination of them. But in the literature review, relatively few published empirical works deal with determinant relations among more than two variables simultaneously in a group of countries. India appears to be well placed in terms of reaping benefits because it has relatively well developed financial sector, strong industrial base and critical mass of well educated workers. III. RESEARCH METHODOLOGY This study is based on secondary data. The required data have been collected from various sources i.e. World Investme Q W 5 H S R U W V $ V L D Q ' H Y H O R S P H Q W % D Q N ¶ V 5 H S R U W V various Bulletins of Reserve Bank of India, publications from Ministry of Commerce, Govt. of India, Economic and Social Survey of Asia and the Pacific, United Nations, Asian Development Outlook, Country Reports on Economic Policy and Trade Practice-Bureau of Economic and Business Affairs, U.S. Department of State and from websites of World Bank, IMF, WTO, RBI, UNCTAD, EXIM Bank etc.. It is a time series data and the relevant data have been collected for the period 1991 to 2011. Thus the objectives of the study can be enumerated as follows: z To assess the determinants of FDI inflows. z To analyze the pattern and direction of FDI flow in India. z To identify factors those are responsible for comparatively lesser flow of FDI. IV. DETERMINANTS OF FDI INFLOWS Foreign direct investment to developing countries has increased substantially in the nineties. The accrual of the benefits of FDI depends largely on factors such as income, growth and appropriate infrastructure and labor policy. According to Dunning [11] (Dunning 1977, 1988; 1993), multinational firms enjoy three distinct types of advantages to producing abroad. They are: (i) ownership advantages; (ii) location advantages; and (iii) internalization advantages. Thus, producing abroad enables the firm to minimize transaction costs and increase productive efficiency. Location advantages, therefore, complete what is known as the eclectic ownership, location and internalization (OLI) paradigm, which is frequently used to explain investment abroad in the form of FDI. A. Market Size 328 Journal of Advanced Management Science Vol. 2, No. 4, December 2014©2014 Engineering and Technology PublishingThe most important of the economic fundamentals, as recognized in the literature, are the market-related variables that may affect market-seeking FDI. Here, there are two factors, i.e., current market size and potential market size. While a large market size generates scale economies, a growing market improves the prospects of market potential and thereby attracts FDI flows (Bhattacharya et al. 1996, Chen and Khan 1997, Mbekeani 1997) [12]. B. Cost Factors Factors that cause investment cost differentials across countries are categorized as cost factors. These include cost of labour, cost of capital and infrastructure costs. Cost factors may significantly influence the choice of an investment location for the resource seeking and efficiency-seeking FDI. It is observed that lower real wages plays an important role in the host country to attract inward FDI. The availability of skilled labour and productivity of labourare also considered as important determinants for FDI inflows where productivity of labour is defined as value added per unit of labour. The impact of cost of capital (i.e. lending interest rates) on FDI inflows is found to be ambiguous in nature and statistically insignificant by many studies. On one hand, it can be argued that higher lending rates may have a positive impact on FDI inflows, i.e., higher the cost of capital in the host country the more capital is brought in by the foreign firms. Alternatively, it can be argued that K R V W F R X Q W U \ ¶ V F R V W R I capital impacts directly on domestic consumption. Thus the lower the interest rates, the higher the domestic consumption and hence higher the FDI inflows (Bende Nende, et al 2000) [13]. With regards to infrastructure costs, it is found that higher the availability of infrastructure lower is the infrastructure costs and higher is the ability of the host country to attract FDI. However, different studies have used different measures to capture availability and cost of infrastructure. Some of the variables used are land and property rents, fuel costs, index of infrastructure, availability of electricity and its cost, transport costs and share of transport and communication to GDP. C. Real Exchange Rates There is mixed evidence on the impact of depreciation of real exchange rate in the host country on FDI inflows. Foreign investors may gain or lose from a devalued exchange rate. They may gain due to larger buying power in host countries. Also they can produce more cheaply and therefore export more easily. This may therefore attract resource seeking and efficiency seeking FDI. However, foreign firms may not enter if they believe that depreciation may continue after they enter a country as this would imply costs to be too high to justify their investments (Trevino, et al. 2002) [14]. They observed devalued exchange rate to encourage inflow of FDI in the host countries, as this would reduce the cost of investment to the foreign firms. D. Macro-Economic Stability FDI faces variability of basic macroeconomic variables (inflation, budget deficit, balance of payments, etc.) across countries. Volatility of macroeconomic policy creates both problems and opportunities for international firms, requiring them to manage the risk inherent in volatile countries, but also presenting the opportunity of moving production to lower cost facilities. A particular kind of macroeconomic instability is that of exchange rate volatility. If exchange-rate changes merely offset price movements so that real purchasing power parity is maintained, the exchange-rate movements would have little real effects. Nevertheless, there is empirical evidence to indicate that purchasing power parity does not hold for all time periods and thus exchange-rate changes can affect the competitiveness of plants in different countries. We observed high volatility of the exchange rate of the currency in the host country to discourage investment by foreign firms as it increases uncertainty regarding the future economic and business prospects of the host country. E. Rate of Inflation Low inflation rate is taken to be a sign of internal economic stability in the host country. High inflation indicates inability of the government to balance its budget, and failure of the central bank to conduct appropriate monetary policy (Schneider and Frey, 1985) [15]. F. Overall Economic Stability The financial health of the host economy is captured by ratio of external debts to exports. It is expected that lower this ratio higher is the probability of economic stability in the country. Studies have used country credit ratings given by various institutions as an indicator of overall economic stability that includes political and macroeconomic stability. However, there arises the question of subjectivity in these ratings since it is found that the ranking of countries based on these ratings differ across estimates provided by different agencies. V. TRENDS AND PATTERNS OF FDI IN INDIA This unprecedented growth of global FDI in 1990 around the world make FDI an important and vital component of development strategy in both developed and developing nations and policies are designed in order to stimulate inward flows. In fact, FDI provides a win ± win situation to the host and the home countries. Foreign direct investment in India increased from US $ 0.129 billion in 1991-92 to US $ 40.885 billion in March, 2005, and US$ above 1, 00, 000 million in 2011 an increase of about 1026 times. (See Table I, Fig. 1) As India is a developing country, capital has been one of the scare resources that are usually required for economic development. Capital is limited and there are many issues such as Health, poverty, employment, education, research and development, technology, global competition. The flow of FDI in India from across the world will help in acquiring the funds at cheaper cost, better technology, employment generation, and upgraded 329 Journal of Advanced Management Science Vol. 2, No. 4, December 2014©2014 Engineering and Technology Publishingtechnology transfer, scope for more trade, linkages and spillovers to domestic firms. TABLE I. FDI INFLOWS IN THE WORLD, SHARE OF INDIA IN WORLD FDI, INDIA ¶S SHARE IN DEVELOPING COUNTRIES ¶ FDI(AMOUNT IN US BILLION DOLLARS) YearsWorldFDIDevelopedEconomiesshare inworld FDIDevelopingEconomiesshare inworld FDI199152.2264.9632.821992133.9265.2332.441993215.6165.4932.061994297.3165.7531.681995225.364.4331996386.157.139.51997478.15639.91998694.569.72719991088.377.120.72000149282.215.92001735.168.427.92002716.176.521.72003632.669.926.32004648.158.6362005958.763.8332006141166.729.320071833.36827.320082441.0369.726.3920092522.757026.0120102604.4172.325.6420112686.1172.625.26 Source: Issues of World Bank, WIR and UNCTAD 024 Figures in US billion dollarsYears World FDI Developed Economies share in world FDI Developing Economies share in world FDI Figure 1. Developed & developing economies share in world FDI. 0.00.51.01.5198619911996200120062011Amount in US billion dollarsYearsIndia's share in World FDI India's share in World FDI Figure 2. , Q G L D ¶ V V K D U H L Q : R U O G ) ' , D P R X Q W L Q 8 6 E L O O L R Q . The explosive growth of FDI gives opportunities to Indian industry for technological up gradation, gaining access to global managerial skills and practices, Optimizing utilization of human and natural resources and competing internationally with higher efficiency. 0 R V W L P S R U W D Q W O \ ) ' , L V F H Q W U D O I R U , Q G L D ¶ V L Q W H J U D W L R Q into global Production chains which involves production by MNCs spread across locations all over the world. (See Table II, Fig. 2, and Fig. 3) TABLE II. FDI INFLOWS IN INDIA (AMOUNT IN US BILLION $) Years DevelopingEconomiesshare in worldFDIIndia's sharein World FDI(amount in USbillion dollars) 1991 32.82 0.0 1992 32.44 0.1 1993 32.06 0.1 1994 31.68 0.2 1995 33 0.3 1996 39.5 0.7 1997 39.9 0.8 1998 27 0.4 1999 20.7 0.2 2000 15.9 0.2 2001 27.9 0.5 2002 21.7 0.5 2003 26.3 0.7 2004 36 0.8 2005 33 0.8 2006 29.3 1.4 2007 27.3 1.3 2008 26.39 1.1 2009 26.01 1.2 2010 25.64 1.3 2011 25.26 1.3 Source: Issues of World Bank, WIR and UNCTAD 0.0020.0040.0060.00198619911996200120062011Amount in US billion dollarsYearsDeveloping Economies share in world FDI Developing Economies share in world FDI Figure 3. Developing economies share in World FDI (amount in US billion $). VI. STATUS OF FDI IN INDIA According to the fact sheet (see Table III) on foreign direct investment dated October 2010, Mauritius is the highest FDI investment in equity inflows with 42% of the total inflow followed by Singapore, USA, UK and Netherlands with 9%, 7%, 5% and 4% respectively. Service sector is the highest FDI attracting inflows with 21% of the total inflows, followed by computer software and hardware, telecommunication and housing and real estate with 9%, 8%, 7% and 7% inflows respectively. /MCI; 20;/MCI; 20; /MCI; 24;/MCI; 24; /MCI; 27;/MCI; 27; /MCI; 31;/MCI; 31; /MCI; 35;/MCI; 35; /MCI; 38;/MCI; 38; /MCI; 41;/MCI; 41; /MCI; 43;/MCI; 43; /MCI; 44;/MCI; 44; /MCI; 45;/MCI; 45; /MCI; 46;/MCI; 46; /MCI; 47;/MCI; 47; /MCI; 48;/MCI; 48; /MCI; 50;/MCI; 50; /MCI; 51;/MCI; 51; /MCI; 52;/MCI; 52; /MCI; 53;/MCI; 53; /MCI; 54;/MCI; 54; /MCI; 55;/MCI; 55; /MCI; 57;/MCI; 57; /MCI; 58;/MCI; 58; /MCI; 59;/MCI; 59; /MCI; 60;/MCI; 60; /MCI; 61;/MCI; 61; /MCI; 62;/MCI; 62; /MCI; 64;/MCI; 64; /MCI; 65;/MCI; 65; /MCI; 66;/MCI; 66; /MCI; 67;/MCI; 67; /MCI; 68;/MCI; 68; /MCI; 69;/MCI; 69; /MCI; 71;/MCI; 71; /MCI; 72;/MCI; 72; /MCI; 73;/MCI; 73; /MCI; 74;/MCI; 74; /MCI; 75;/MCI; 75; /MCI; 76;/MCI; 76; /MCI; 78;/MCI; 78; /MCI; 79;/MCI; 79; /MCI; 80;/MCI; 80; /MCI; 81;/MCI; 81; /MCI; 82;/MCI; 82; /MCI; 83;/MCI; 83; /MCI; 85;/MCI; 85; /MCI; 86;/MCI; 86; /MCI; 87;/MCI; 87; /MCI; 88;/MCI; 88; /MCI; 89;/MCI; 89; /MCI; 90;/MCI; 90; /MCI; 92;/MCI; 92; /MCI; 93;/MCI; 93; /MCI; 94;/MCI; 94; /MCI; 95;/MCI; 95; /MCI; 96;/MCI; 96; /MCI; 97;/MCI; 97; /MCI; 99;/MCI; 99; /MCI; 10;/MCI; 10; /MCI; 10;á/MCI; 10;á /MCI; 10;â/MCI; 10;â /MCI; 10;ã/MCI; 10;ã /MCI; 10;ä/MCI; 10;ä /MCI; 10;æ/MCI; 10;æ /MCI; 10;ç/MCI; 10;ç /MCI; 10;è/MCI; 10;è /MCI; 10;é/MCI; 10;é /MCI; 11;/MCI; 11; /MCI; 11;á/MCI; 11;á /MCI; 11;ã/MCI; 11;ã /MCI; 11;ä/MCI; 11;ä /MCI; 11;å/MCI; 11;å /MCI; 11;æ/MCI; 11;æ /MCI; 11;ç/MCI; 11;ç /MCI; 11;è/MCI; 11;è /MCI; 12;/MCI; 12; /MCI; 12;á/MCI; 12;á /MCI; 12;â/MCI; 12;â /MCI; 12;ã/MCI; 12;ã /MCI; 12;ä/MCI; 12;ä /MCI; 12;å/MCI; 12;å /MCI; 12;ç/MCI; 12;ç /MCI; 12;è/MCI; 12;è /MCI; 12;é/MCI; 12;é /MCI; 13;/MCI; 13; /MCI; 13;á/MCI; 13;á /MCI; 13;â/MCI; 13;â /MCI; 13;ä/MCI; 13;ä 330 Journal of Advanced Management Science Vol. 2, No. 4, December 2014©2014 Engineering and Technology PublishingTABLE III. SOURCES OF FDI IN INDIA CountryAmount of FDI Inflows(amount in US million $)% with total FDI inflowsMauritius51719.542.16Singapore11471.99.35USA9186.377.49UK6225.585.07Netherlands5254.894.28Cyprus4322.363.52Japan4300.293.51 Source: compiled & computed from the various issues of Economic Survey, RBI Bulletin, Ministry of Commerce A report released in February 2010 by Leeds University Business School, commissioned by UK Trade & Investment (UKTI), ranks India among the top three countries where British companies can do better business during 2012-14. According to Ernst and Young's 2010 European Attractiveness Survey, India is ranked as the fourth most attractive foreign direct investment destination in 2010. VII. OUTFLOWS A significant uptrend in outward FDI has also been observed in the case of India in recent years. Since globalization is a two-way process, integration of the Indian economy with the rest of the world is evident not only in terms of higher level of FDI inflows but also in terms of increasing level of FDI outflows. In the Indian context, overseas investments in joint ventures (JV) and wholly owned subsidiaries (WOS) have been recognised as important channels for promoting global business by the Indian entrepreneurs. The broad approach has been to facilitate outward foreign direct investment through joint ventures and wholly owned subsidiaries and provision of financial support to promote exports including project exports from India. With a steady rise in capital inflows, particularly in the second half of 2000s, the overall foreign exchange reserve position provided comfort to progressive relaxation of the capital controls and simplification of the procedures for outbound investments from India. Three distinct overlapping phases as under can be discerned in the evolution of the Indian outward FDI policies. $ F F R U G L Q J W R 8 1 &