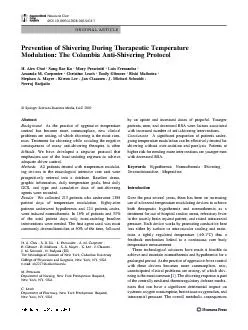
PPT-Sea surface height variation & mean sea level applicati
Author : stefany-barnette | Published Date : 2015-11-27
Vinca Rosmorduc CLS Aviso Aviso A rchiving V alidation and I nterpretation of S atellite O ceanographic data French Distributing and Archiving center for satellite
Presentation Embed Code
Download Presentation
Download Presentation The PPT/PDF document "Sea surface height variation & mean ..." is the property of its rightful owner. Permission is granted to download and print the materials on this website for personal, non-commercial use only, and to display it on your personal computer provided you do not modify the materials and that you retain all copyright notices contained in the materials. By downloading content from our website, you accept the terms of this agreement.
Sea surface height variation & mean sea level applicati: Transcript
Vinca Rosmorduc CLS Aviso Aviso A rchiving V alidation and I nterpretation of S atellite O ceanographic data French Distributing and Archiving center for satellite altimetry data since 1992 TopexPoseidon launch. Stats Day 2014. Jason Ellwood. Otumoetai. College. Today... A look through, and go at, . some. . activities designed to give students visual and conceptual . appreciation . of what sampling variation is and how it impacts on statistical investigation in 91264. Robert Fovell. UCLA Atmospheric and Oceanic Sciences. rfovell@ucla.edu. 1. Notes. Everything in this presentation should be familiar. Please feel free to ask questions, and remember to refer to slide numbers if/when possible. Linda S. Gottfredson. School of Education. University of Delaware. Newark, DE 19716 USA. A keynote talk at the. International Society for the Study of Individual Differences. Chicago, IL. July 19, 2009. Ibrahim Banat. Professor of . Microbial Biotechnology. University . of Ulster, UK. .. ABRUEM Delegation Visit to Ulster University 13th June 2016. Biosurfactants. . Surfactants that are produced by bio-organisms are called biosurfactants. ATM 419. Spring 2016. Fovell. 1. U-bar. (sustained wind). gusts ≠ u’. Reynolds averaging into U-bar and u’. Klemp. and Lilly (1975) _ Boulder windstorm. 2. Averaging interval long relative to fluctuations. Atmospheric Forces and Wind. Last Time. Temperature. How is it measured. Diurnal, annual, . interannual. cycles. Diurnal cycle depends on:. Solar radiation and . longwave. radiation, balance. Annual variations depend on:. SO 254 – Spring 2017. Let’s now take a closer look at the gravitational force. . Intuitively we recognize that . is conservative, therefore it is the gradient of some . potential function. . . Product: TATO (A7527) Type: Materials used: Producer: FUN TIME ltd Dimensions: 3185 x 2980 x 2625 mm (lenght x width x height) Safety area: 6455 x 6470 mm / 30 m2 Platform height: 990 mm Max. fall he Significance:. Forty years of satellite remote sensing reveals an ablation zone expanded in size, its albedo and surface elevation lower in response to enhanced melting and ice discharge, and an ice sheet transition from steady state to negative mass balance. Satellite remote sensing provides a critical tool for continued monitoring of the GrIS mass balance.. 1 1 DOI: 10.7860/JCDR/2022/53408.16080 Original Article Orthopaedics Section Measurement of Subaxial Cervical Vertebral Height using Computed Tomography for Optimisation of Anterior Cervical Plate i and Experiment #7. ATM . 419/563. Spring . 2019. Fovell. 1. Outline. More information on NESIS. Methods of estimating snow depths from model outputs. Initializing WRF with the NARR reanalysis. Experiment #7 physics contest. Basic Concepts. Rich Thompson. SPC. Rich. Roger. Shut up!. I . wanna. play the . dryline. !. STPs are. high along the warm front. Grew up in Houston, TX, with a life-long interest in weather. Meteorology graduate from OU. Derek van Westrum, Ph.D.. NGS Observations and Analysis Division. derek.vanwestrum@noaa.gov. NOAA’s National Geodetic Survey. geodesy.noaa.gov. 1. A Bit About Me. I’m Derek van . Westrum. I’ve been a physicist with NOAA’s National Geodetic Survey for 5 years. Robert Fovell. UCLA Atmospheric and Oceanic Sciences. rfovell@ucla.edu. 1. Notes. Everything in this presentation should be familiar. Please feel free to ask questions, and remember to refer to slide numbers if/when possible.
Download Document
Here is the link to download the presentation.
"Sea surface height variation & mean sea level applicati"The content belongs to its owner. You may download and print it for personal use, without modification, and keep all copyright notices. By downloading, you agree to these terms.
Related Documents