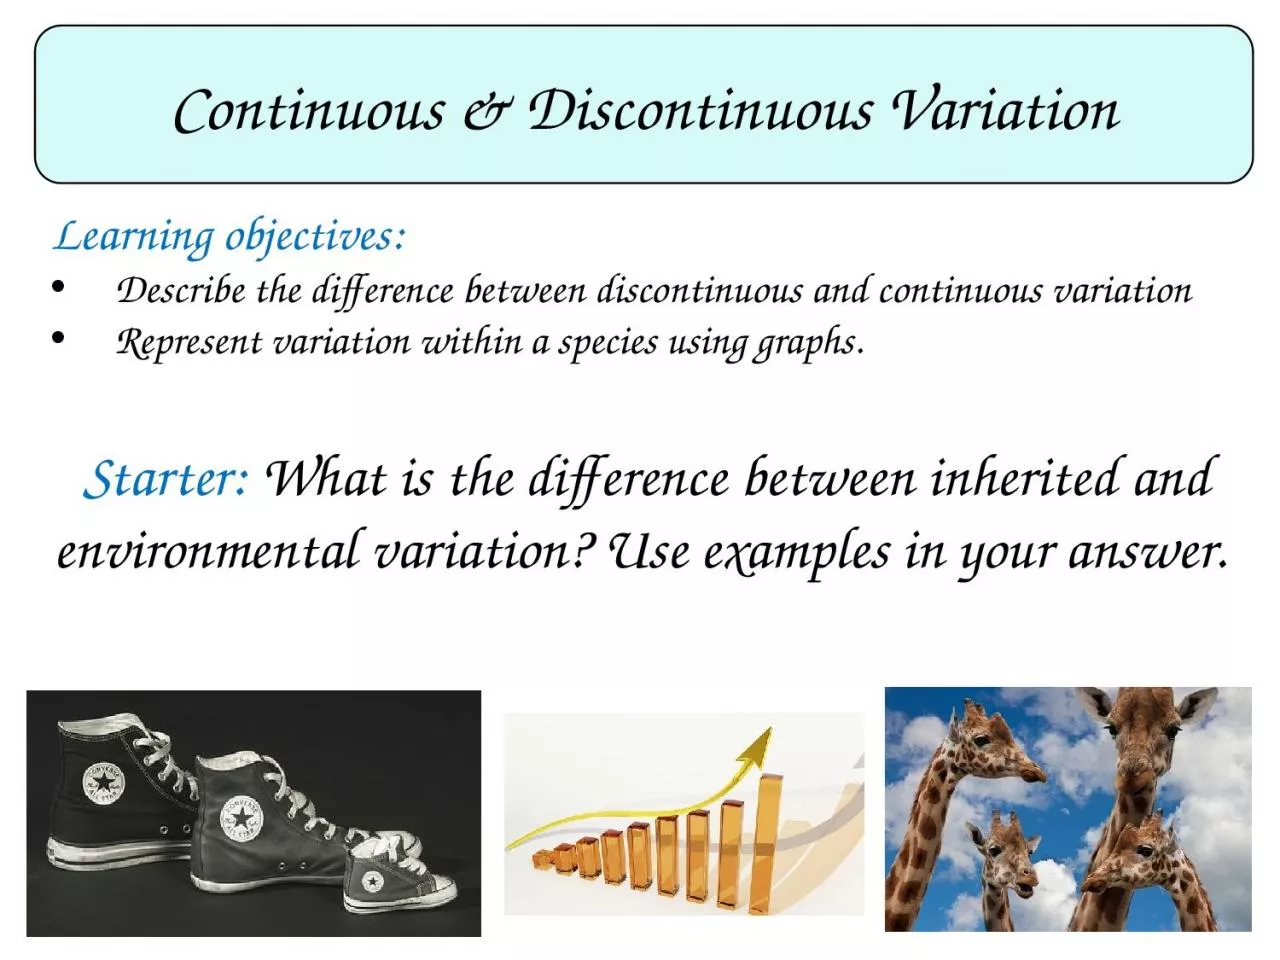
Learning objectives Describe the difference between discontinuous and continuous variation Represent variation within a species using graphs Starter What is the difference between inherited and environmental variation Use examples in your answer ID: 933874
Download Presentation The PPT/PDF document "Continuous & Discontinuous Variation" is the property of its rightful owner. Permission is granted to download and print the materials on this web site for personal, non-commercial use only, and to display it on your personal computer provided you do not modify the materials and that you retain all copyright notices contained in the materials. By downloading content from our website, you accept the terms of this agreement.
Slide1
Continuous & Discontinuous Variation
Learning objectives:
Describe the difference between discontinuous and continuous variationRepresent variation within a species using graphs.
Starter: What is the difference between inherited and environmental variation? Use examples in your answer.
Slide2Organise yourselves according to your eye colour.
Organise yourselves according to your gender.Organise yourselves according to your height.
Everyone out of their seats, you are going to organize yourselves based on the following factors:
Continuous & Discontinuous Variation
Think > Pair > Share: What do you notice about the way your organized yourselves for each of these different factors?
Slide3When you organized yourselves into groups according to gender
or eye colour, you divided yourselves into
distinct groups. E.g. male or female, green/brown/blue eyes. This is known as discontinuous variation.
Discontinuous variation
Slide4When you organized yourselves into groups according to height
, you arranged yourselves into one big group standing in height order – shortest to tallest
. A characteristics that can take any value within a range is known as continuous variation.Continuous variation
Slide5The Great Big Class Survey
Task:
You are going to be organised into groups, each group will be assigned a characteristic. You will need to collect data on this characteristic from at least 20 people in your class, for example shoe size or eye colour. Group 1 – Eye colour
Group 2 – Lobed/Lobeless Ears
Group 3 - Height
Group 4 – Arm length
Group 5 – Handedness (R/L)
Group 5 – Hand span
Slide6Discontinuous or continuous variation
You were each assigned a characteristic to collect class data on.
Think > Pair > Share: Which of these categories are examples of continuous variation? Which are examples of discontinuous variation?
Eye Colour
Handedness
Shoe sizeHeight
Hand span
Lobed/Lobeless Ears
Slide7Discontinuous: Eye colour, handedness & lobed/lobeless ears.
Continuous: Hand span, arm length & height.
Self-assessment:
Slide8Plotting discontinuous & continuous data
Blood Group
A B AB O
Number of people
Number of people
Height (cm)
Up to 120
121-125
126-130
131 - 135
136 - 140
141 - 145
146 - 150
Discontinuous data can be plotted on a
bar chart
. For example, a person can only have one of four blood groups – A, B, AB or O.
Continuous data is plotted on a
histogram
, this shows a range of measurements from one extreme to another. The curve that the graph produces is know as
normal distribution
.
Slide9Group 1 – Eye colour
Group 2 – Lobed/Lobeless Ears
Group 3 - Height
Group 4 – Arm length
Group 5 – Handedness (R/L)
Group 5 – Hand span
Task:
Now, go back to sitting in your groups and use the data that you collected to plot a graph of your results. (One graph per person, not per group
!!)
Slide10Task: Answer the questions on the worksheet, using the data provided.
Slide11Self-assessment:
1.Bar chartDiscontinuousNo normal distribution
2.ContinuousThe older the cheetah the faster they are able to runNot very reliable as the top speeds of only three cheetahs were measured3.ContinuousYes it shows normal distribution
Ask a larger number of women
Slide12Plenary
– WhatsApp message
Write a WhatsApp message to your friend telling them what you have learnt this lesson!!
Slide13Resources
Slide14a) What sort of graph is this?
_____________________________________________
b) Is the data continuous or discontinuous? _____________________________________________ c) Does this graph show normal distribution? _____________________________________________
2. The graph shows tops speeds reached by three different cheetahs. a) Is the data continuous or discontinuous? _____________________________________________ b) Is relationship does this graph show? _____________________________________________ c) How reliable do you think the data is for predicting the speeds of cheetahs? Explain your answer. _____________________________________________
3. a) Is the data continuous or discontinuous? _____________________________________________ b) Does this graph show normal distribution? _____________________________________________ c) What could be done to improve the reliability of this data?
_____________________________________________
Slide15Number of people
Arm span (cm)
101 - 105
126 - 130
106 - 110
111 - 115
116 - 120
121 - 125
131 - 135
Top speed (km/h)
Age (years)
0 0.5 1.0 1.5