/
U.S. Nursing Homes and Single Payer U.S. Nursing Homes and Single Payer

U.S. Nursing Homes and Single Payer - PowerPoint Presentation

stefany-barnette
stefany-barnette . @stefany-barnette
Follow
377 views
Uploaded On 2017-08-14

U.S. Nursing Homes and Single Payer - PPT Presentation

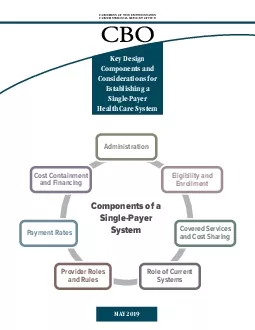
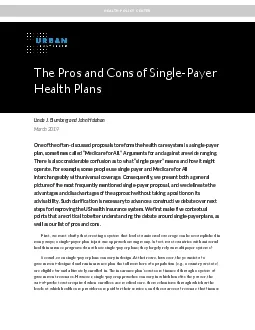
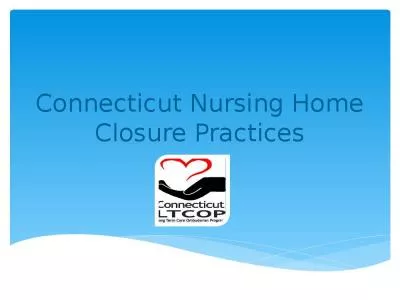
PNHP Annual Meeting November 2 2013 Boston MA Christopher Cherney Nursing Home Administrator Berkeley California ccherneyearthlinknet US Nursing Homes 15500 skilled nursing facilities SNFs ID: 578712

2013 nursing annual pnhp nursing 2013 pnhp annual meeting november care homes profit hours billion term long staffing snf

Share:

Link:

Embed:

Download Presentation from below link

Download Presentation The PPT/PDF document "U.S. Nursing Homes and Single Payer" is the property of its rightful owner. Permission is granted to download and print the materials on this web site for personal, non-commercial use only, and to display it on your personal computer provided you do not modify the materials and that you retain all copyright notices contained in the materials. By downloading content from our website, you accept the terms of this agreement.


Presentation Transcript

Slide1

U.S. Nursing Homes and Single Payer

PNHP Annual Meeting November 2, 2013 Boston, MA

Christopher Cherney

Nursing Home

Administrator

Berkeley, California

ccherney@earthlink.netSlide2

U.S. Nursing Homes

15,500 skilled nursing facilities (SNFs)

Compare: 13,000 McDonald’s restaurants

1.4 million “residents” in 1.6 million available beds88% occupancy3.2 million admissions per yearSource: CMS, 2009

November 2, 2013

PNHP Annual Meeting

2Slide3

U.S. Nursing Homes

Resident characteristics

Average

age, 79 years71% of residents are female60% cannot perform at least three activities of daily living40% have a cognitive impairmentSource: CMS, 2009

November 2, 2013

PNHP Annual Meeting

3Slide4

U.S. Nursing Home Revenues

$

144 billion

in gross revenueAbout 6% of total U.S. health care expendituresAbout 15 times greater than Hollywood gross revenue67% of U.S. nursing homes are for-profit27% non-profit

OK, TX, CA85% of SNFs are for-profit

Source: CMS, 2009

November 2, 2013

PNHP Annual Meeting

4Slide5

Nursing Home Revenue Sources

Public

Sources

$92 billion 64%Medicare

$30 billion 21%

Medicaid $62 billion 4

3% 

Private Sources

$

52 billion 36

%

Private insurance

$10 billion

7%

Out-of-pocket*

$

42

billion 29%

*Includes Social Security income

Source: CMS. (2009). National Health Expenditures.

November 2, 2013

PNHP Annual Meeting

5Slide6

Nursing Homes:

Almost

Single Payer

About 70% of all dollars paid to U.S. nursing homes ALREADY comes from public sources.For thousands of U.S. nursing homes, the government is the sole payer. November 2, 2013

PNHP Annual Meeting

6Slide7

Ten Biggest U.S. Nursing Home Companies

City, Total Total Total Ownership

Company State Beds SNFs Revenue Type HCR Manor Care Toledo, OH 28,092 277 n/a for-profit

Golden Living Plano, TX 31,143 305 n/a for-profitLife Care Centers Cleveland, OH 29,272 221 n/a for-profit

Kindred Louisville, KY 27,905 226 $4.35B for-profit

Sun Healthcare Irvine, CA 22,243 200 $1.9B for-profit

SavaSeniorCare

Atlanta, GA 21,279 186 n/a for-profit

Extendicare Milwaukee, WI 16,889 167 $1.3B for-profit

Evang. Lutheran Sioux Falls, SD 12,419 177 $915M non-profit

Skilled H Group Foothill Ranch, CA 10,456 74 n/a for-profit

TOTALS 199,698 1,833

Source:

Provider

magazine, June 2011.

November 2, 2013

PNHP Annual Meeting

7Slide8

Nursing Home Finance 101

Maximize Revenue

Minimize Expense

Every nursing home’s greatest expense is labor.Labor expense ranges between 60-80% of every nursing home’s budget.November 2, 2013

PNHP Annual Meeting

8Slide9

9

Managing SNF Expenses

Expense Estimates

Low-quality High-quality

For-profit Non-profit

Wages/Benefits 63% 80%

Administration 13% 9%

Management fee 9% 0%

Rent 7% 2%

Profit 4% 3%

Maintenance

3

% 5%

Bad debt 1% 1

%

Administrators of for-profit nursing homes quickly learn: pay rent and management fees first!!

PNHP Annual Meeting

November 2, 2013Slide10

10

SNFs Generate Profits on Multiple Fronts

Nursing Home

Management

Company

Real estate

company

Rehab company

Pharmacy

company

PROFIT

DME company

Monthly fee ranges from 5-9%

Rent = 7-12% of monthly gross

Rehab, pharmacy, and DME companies frequently are closely-held affiliates of the management company principals

PNHP Annual Meeting

RENT AND MANAGEMENT FEES EQUAL 10

to

20-plus PERCENT OF GROSS REVENUES

November 2, 2013Slide11

11

The

R(eal

)E

(state)AL

Mone

y

Stock

Market

Nursing Homes

REIT Symbol

Cap.

in Portfolio

Health Care Property Investors HCP $

19.4

B

333

Ventas

, Inc. VTR

$19.2

B

381

Health Care REIT, Inc. HCN

$18.6

B

250

Omega

Healthcare Investors, Inc. OHI $3.9 B

150

Sources:Market

capitalization,

Wikinvest

, 2013; Nursing homes in portfolio: annual reports

PNHP Annual Meeting

Ventas

Board of Directors includes

Jay

Gellert

, CEO,

HealthNet

Robert Reed, CFO, Sutter Health

Ventas

, Inc. Board of Directors

November 2, 2013Slide12

SNF Direct Care Staffing

Federal requirement: “sufficient staff”

No numeric minimum

Some estimate that 90% of SNFs fail to provide sufficient staff to meet resident needsSome state staffing standardsTN 2.0 hours per patient per day (PPD)PA 2.7 hours PPDCA 3.2 hours PPDDE 3.6 hours PPD

Expert-recommended standardNo less than 4.13 hours PPD

November 2, 2013

PNHP Annual Meeting

12Slide13

Nursing Home Staffing

70% of direct care provided by Certified Nursing Assistants (C.N.A.s)

C.N.A.s receive 75 hours of training (~2 weeks)

16 hours of which must be hands-on$24,000 per year average wage$11.54 per hourOne in three C.N.A.s receives public assistance

Registered Nurses provide about 25% of licensed nursing hours.

November 2, 2013

PNHP Annual Meeting

13Slide14

Maximizing SNF Profit

The easiest way to optimize SNF profit is to limit direct care staffing

Primarily by “not replacing” staff who call off sick.

An effective way to limit this widespread practice is to link SNF reimbursement to actual staffing levels, based on electronic payroll recordsSection 6106 of the Affordable Care Act, entitled “Ensuring Staffing Accountability,” requires SNFs to “submit staffing information based on payroll data in a uniform format.”

November 2, 2013

PNHP Annual Meeting

14Slide15

The U.S. Nursing Home Paradigm

About $100 billion per year in public monies flows to mostly for-profit corporations, to care for elderly, mostly-impoverished, dependent adults, at substandard staffing levels, in facilities largely owned by profit-seeking real estate investors.

November 2, 2013

PNHP Annual Meeting

15Slide16

Lack of U.S. Geriatricians

In 2012, there were 7,356 board-certified U.S. geriatricians.

A high-quality long-term care system will require more physicians who specialize in geriatrics

.November 2, 2013PNHP Annual Meeting

16Slide17

Nursing Homes and Single Payer

Key political issues

Emphasize that the current system, although privatized and

profitized, is financed by an almost-single payer.Eliminate profit-making, especially real estate profit-making.Provide living wages and benefits for frontline staff, especially C.N.A.s.

Key operational issues

Enforce minimum staffing standards of 4.1 hours per resident per day, based on payroll records.Ensure greater

physical presence in nursing homes of Geriatricians and Registered Nurses.

November 2, 2013

PNHP Annual Meeting

17Slide18

Call to Action

Stay committed to PNHP at your local level.

Let us know if you are willing to serve on a PNHP Long-Term Care Program Workgroup.

November 2, 2013PNHP Annual Meeting

18Slide19

Call to Action

Promote discussion among your peers about geriatrics.

Always mention long-term care in your discussions on single-payer national health care!

November 2, 2013

PNHP Annual Meeting

19Slide20

Additional Slides

November 2, 2013

PNHP Annual Meeting20Slide21

The Need for Long-Term Care

Long-Term Care Services and Supports (LTCSS)

Defined as assistance with activities of daily living to people who cannot perform them on their own

12 million Americans rely on LTCSS (4% of population)56% are age 65 or older$211 billion spent on LTCS in 2011More than half spent on nursing homesCurrently, 62% of LTCSS are paid by Medicaid

Source: U.S. Senate Commission on Long-Term Care Report to Congress, September 18, 2013

November 2, 2013

PNHP Annual Meeting

21Slide22

The Unaffordability of LTCSS

Only 1 in 3 older U.S. adults has non-housing financial assets equivalent to one year of SNF care ($70,000).

46% of elderly households have less than $10,000 in non-housing assets.

Source: U.S. Senate Commission on Long-Term Care Report to Congress, September 18, 2013

November 2, 2013

PNHP Annual Meeting

22Slide23

How to Finance LTCSS

Expand Medicare or create Part L (for consolidated Long-Term Care services)

Social insurance model

Mandatory participationPublic financingSpreads risk broadlyEveryone is at risk for needing LTCSSNovember 2, 2013

PNHP Annual Meeting

23