/
Chapter 44: Population Ecology Chapter 44: Population Ecology

Chapter 44: Population Ecology - PowerPoint Presentation

summer
summer . @summer
Follow
65 views
Uploaded On 2023-10-28

Chapter 44: Population Ecology - PPT Presentation

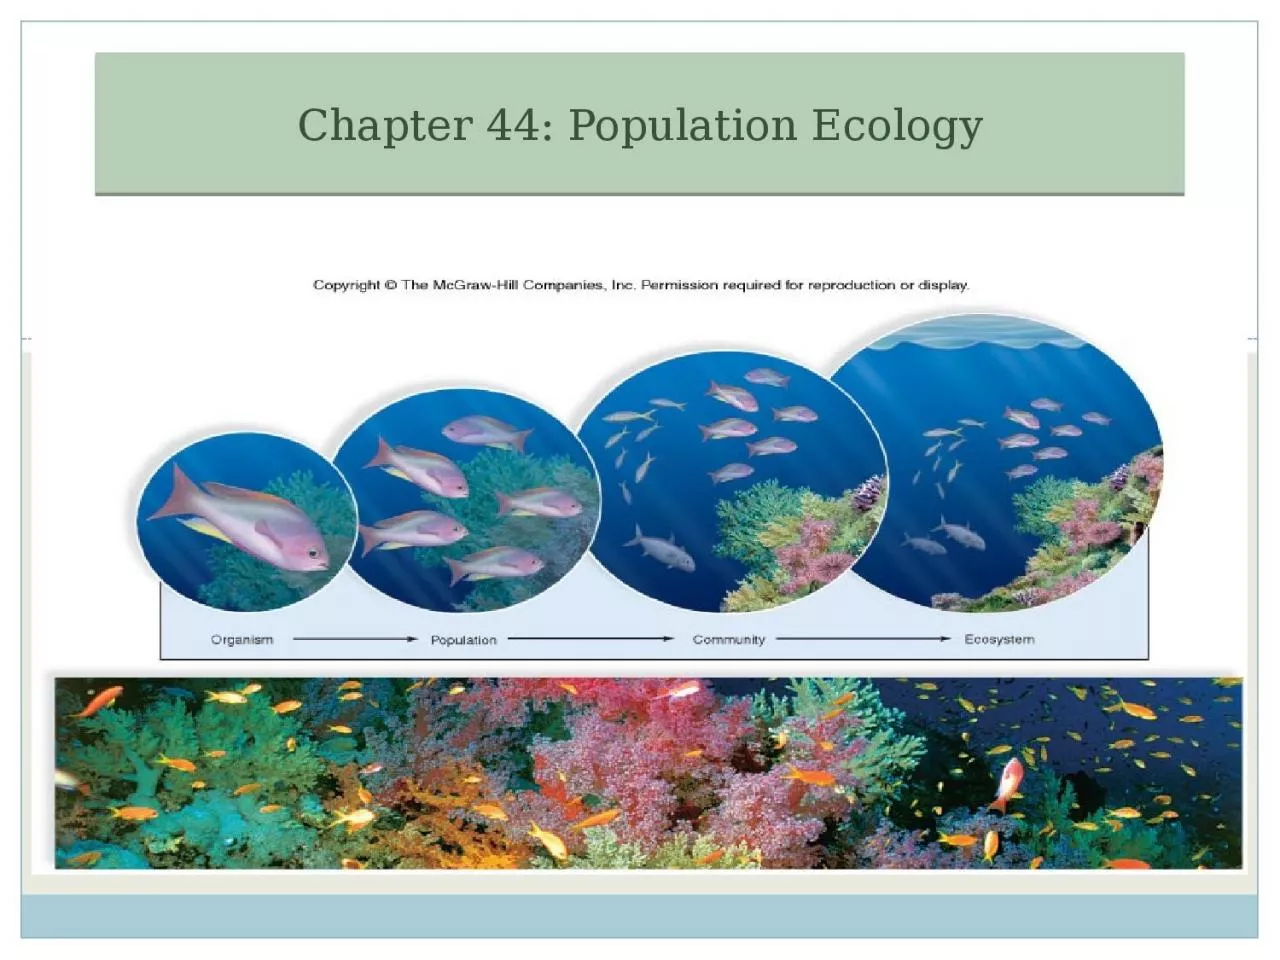
Course Objectives Define the following ecological terms Population population density community population distribution diversity Limiting factors resources biotic potential r carrying capacity ID: 1025909

growth population individuals density population growth density individuals life factors exponential species number selection reproductive strategists biotic curves history

Share:

Link:

Embed:

Download Presentation from below link

Download Presentation The PPT/PDF document "Chapter 44: Population Ecology" is the property of its rightful owner. Permission is granted to download and print the materials on this web site for personal, non-commercial use only, and to display it on your personal computer provided you do not modify the materials and that you retain all copyright notices contained in the materials. By downloading content from our website, you accept the terms of this agreement.


Presentation Transcript

1. Chapter 44: Population Ecology

2. Course ObjectivesDefine the following ecological terms: Population, population density, community, population distribution, diversity, Limiting factors, resources, biotic potential (r ), carrying capacity ( K ), Survivorship.Also, Exponential Growth vs. Logistic Growth and the corresponding curves on a graph.

3. 44.1 Scope of EcologyErnst Haeckel, 1866 Ecology: the study of the interactions among all organisms and with their physical environment. Ecology , as a study, has many levels:HabitatPopulationCommunityEcosystemBiosphereA central goal of modern ecology is to develop models that explain and predict the distribution and abundance of organisms.

4. The Scope of Ecology

5. 44. 2 Demographics of PopulationsDemography: the statistical study of a population, such as its density, distribution and rate of growth.Population density: the number of individuals per unit of area ( example 73 / sq. mi in USA)Resources: the abiotic (non living) and biotic (living) components of an environment. water, shelter, food, mates, space etc.Limiting Factors: are those environmental aspects that particularly determine where an organism lives. - sometimes are the maximum tolerance of certain environmental conditions that an organism can live in. Example: Fish in water at different temps and oxygen levels

6. Patterns of DistributionThree main observed types:Clumped RandomUniformHowever patterns are also relative to scale!!Kangaroos may seem clumped if you look at a global scale ( they are all grouped in Australia) Also, distribution patterns do not have to remain constant but can change with the organisms stage of life.

7. Population GrowthRate of natural increase (r ) : “growth rate” which is dependent on the number of individuals born each year and the number of individuals that die each year. Example: 30 births -10 deaths / 1000 = .02 = 2.0 % Biotic Potential :the highest possible rate of natural increase when resources are unlimited. Biotic Potential depends on certain characteristics: Usual number of offspring per reproductive event Chances of survival until age of reproduction How often each individual reproduces Age at which reproduction beginsMortality patternsCohort: all the members of a population born at the same time. Cohorts are used to create life table.

8. Population GrowthSurvivorship Curves: Type IType IIType III

9. Survivorship CurvesSurvivorship : the probability of newborn individuals of a cohort surviving to particular agesSurvivorship Curves: Type IType IIType III

10. 44. 3 Population Growth ModelsSemelparity : members of the population have only a single reproductive event in their lifetime.Characteristics at reproductive time, mature adults stop growing all energy is directed (and used) for reproduction adults die after reproducing this is adaptive to unstable environments Iteroparity: members of the population experience many reproductive events throughout lifetime.Characteristics: continue to invest energy into continued survival this increases their chances of reproducing againIt is important to know that not all reproduction fits these two models but most will.The two models of population growth have characteristic graphs

11. Exponential and Logistic GrowthA species model of population growth can be used to predict the future population growth.Semelparous species often exhibit Exponential Growth ( seen as a J curve).Exponential Growth = number of individuals added each generation increases as the total number of females increases. The J curve has two phases:Lag phaseExponential growth phase R= 2.4*R is used for discreet breeding events instead of r

12. Exponential and Logistic GrowthLogistic Growth (sigmoidial curve or S curve)Lag phaseExponential growth phase Deceleration PhaseStable equilibrium phase.This is seen when the environmental factors oppose growthCarrying Capacity (K) : the maximum number of individuals of a given species the environment can support.

13. Growth Curves and Population ManagementExponential growth and Logistic growth curves both can be used to indicate what management strategies to use.If you want to keep birth rates high then keep a population small enough to stay in exponential growth so that biotic potential can have full effect (fish farm for food)If you want to keep a population limited (such as a crop pest), then do things in the environment that will reduce the carrying capacity ( instead of reducing population which brings you back to exponential growth)

14. 44.4 Regulation of Population SizeFactors That Regulate Population Growth Density-Independent Factors : the intensity of the effect does not increase with increased population density.Abiotic factors such as freezes, droughts, forest fires, floods etc are usually density –independent factors.

15. 44. Regulation of Population SizeFactors That Regulate Population Growth Density Dependent Factors: the percentage of the population affected does increase as the density of the population increases.Biotic factors such competition and parasitism, diseases are often.Competition Example: Woodpeckers

16. 44. Regulation of Population SizeDensity Dependent FactorsPredation Example: Hawk and field mice

17. 44. 5 Life History PatternsPopulations can vary on the number of births per reproductive event, age of reproduction, life span etc.These are part of species life history. Life histories often contain characteristics that are trade-offs and Natural Selection shapes the final life history of individual species and therefore it is not surprising that related species may have different life history patterns.Example : Frogs and Toads

18. 44. 5 Life History Patterns: r-selection vs. K-selectionLogistic population growth model suggests that some organisms are subject to r-selection or k-selection and thus are called r-strategists or K-strategists(as in reproductive strategies) r-selection (favors r-strategists)-fluctuating and/or unpredictable environments -density-dependent factors will keep populations in the lag or exponential phase of population growth. -Population size is low relative to the carrying capacity (K) (so this means low pop density) r-strategists organismsSmall individuals that mature earlyShort lifespan Produce many relatively small offspringno energy invested in parental care -usually are very good dispersers and colonizes of new habitats-examples are opportunistic species (annual plants , rodents, bacteria & insects)

19. r-selection vs. K-selectionK-selection (favors K-strategists)-Environments are relatively stable-Population sizes tend to be near K-Resources such as food and shelter will be relatively scarce for these individuals-thus those that are best able to compete will have larger numbers of offspringK-strategists -energy invested in their own growth and survival-energy invested in offspring-individuals are fairly large-late to mature-low fecundity and parity-fairly long lived-”equilibrium species” strong competetors and when they become established can exclude opportunistic species (florida panther and large mammals, birds of prey and long-lived plants like oak trees)