/
Where the States Stand on Abortion Policy Where the States Stand on Abortion Policy

Where the States Stand on Abortion Policy - PowerPoint Presentation

summer
summer . @summer
Follow
65 views
Uploaded On 2023-11-16

Where the States Stand on Abortion Policy - PPT Presentation

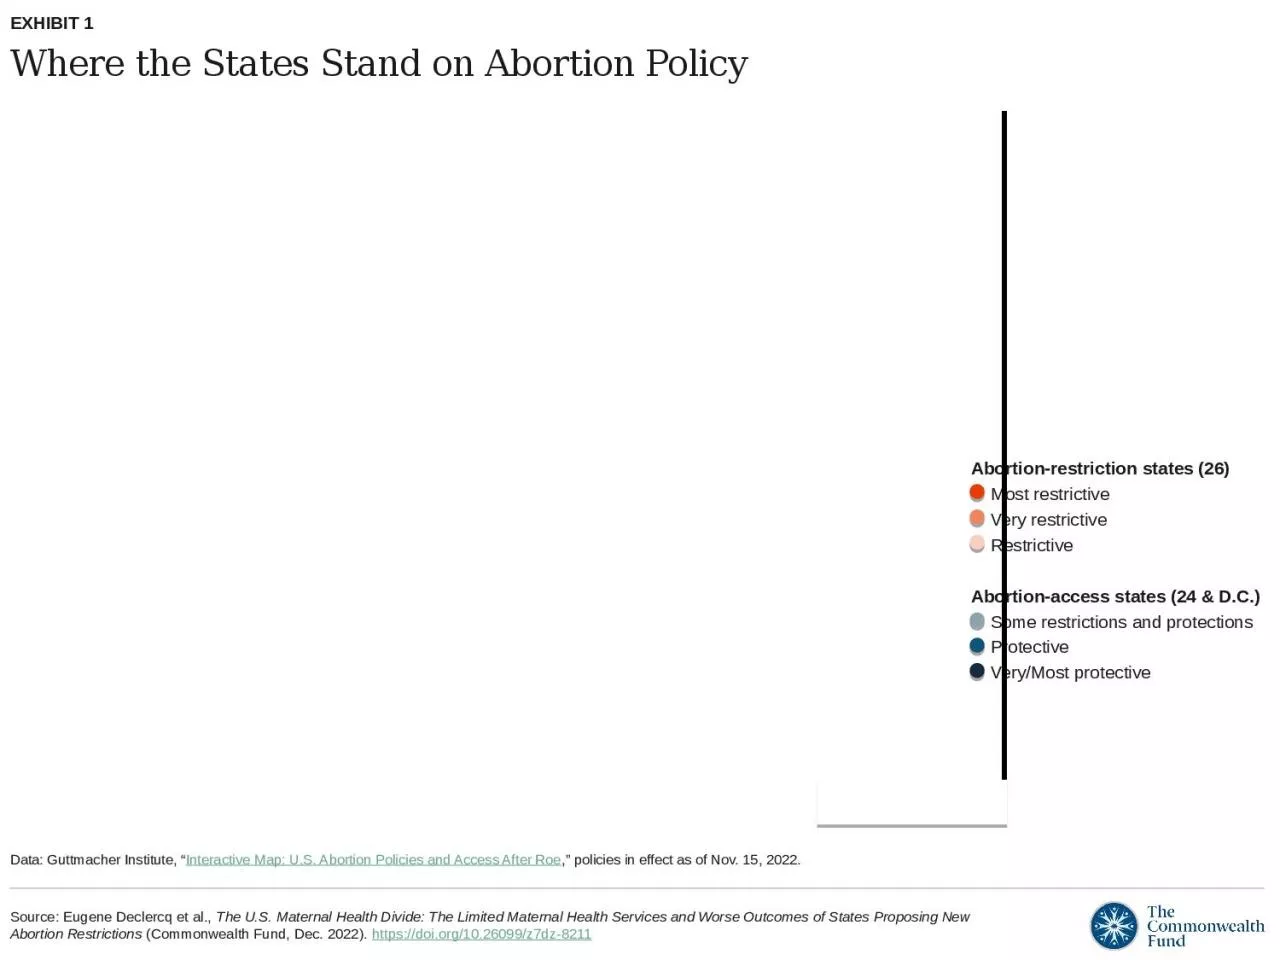
EXHIBIT 1 Data Guttmacher Institute Interactive Map US Abortion Policies and Access After Roe policies in effect as of Nov 15 2022 Abortionrestriction states 26 Most restrictive ID: 1032059

health abortion state mortality abortion health mortality state data 2020exhibit policy control care prevention cdc access disease 2020 centers

Share:

Link:

Embed:

Download Presentation from below link

Download Presentation The PPT/PDF document "Where the States Stand on Abortion Polic..." is the property of its rightful owner. Permission is granted to download and print the materials on this web site for personal, non-commercial use only, and to display it on your personal computer provided you do not modify the materials and that you retain all copyright notices contained in the materials. By downloading content from our website, you accept the terms of this agreement.


Presentation Transcript

1. Where the States Stand on Abortion PolicyEXHIBIT 1Data: Guttmacher Institute, “Interactive Map: U.S. Abortion Policies and Access After Roe,” policies in effect as of Nov. 15, 2022.Abortion-restriction states (26) Most restrictive Very restrictive RestrictiveAbortion-access states (24 & D.C.) Some restrictions and protections Protective Very/Most protective

2. U.S. Births, by Race/Ethnicity and State Abortion Policy, 2020EXHIBIT 2Note: AIAN = American Indian or Alaska Native.Data: Centers for Disease Control and Prevention, CDC WONDER (database), “Natality, 2016–2020,” accessed Nov. 15, 2022.Abortion-restriction states26 states1.98 million birthsAbortion-access states24 states & D.C.1.63 million births

3. Maternity Care Resources, by State Abortion Policy, 2020EXHIBIT 3Notes: OBs = obstetricians; CNMs = certified nurse midwives. “Maternity care deserts” defined as counties in which access to maternity health care services is limited or absent, either through lack of services or barriers to a woman’s ability to access that care within counties.Data: Providers — Health Resources and Services Administration, “Area Health Resources Files,” HRSA, last updated July 31, 2021; Maternity deserts — March of Dimes, Nowhere to Go: Maternity Care Deserts Across the U.S.: 2020 Report (March of Dimes, 2020).

4. Maternal Deaths per 100,000 Births, by State Abortion Policy, 2018–2020EXHIBIT 4Data: Centers for Disease Control and Prevention, “National Center for Health Statistics Mortality Data on CDC WONDER,” last updated Dec. 22, 2021.

5. Maternal Deaths per 100,000 Births, by Race/Ethnicity and State Abortion Policy, 2018–2020EXHIBIT 5Note: AIAN = American Indian or Alaska Native.Data: Centers for Disease Control and Prevention, “National Center for Health Statistics Mortality Data on CDC WONDER,” last updated Dec. 22, 2021.

6. Deaths Among Women Ages 15–44 per 100,000 Population, by Race/Ethnicity and State Abortion Policy, 2018–2020EXHIBIT 6Note: AIAN = American Indian or Alaska Native.Data: Centers for Disease Control and Prevention, “National Center for Health Statistics Mortality Data on CDC WONDER,” last updated Dec. 22, 2021.

7. State Infant and Perinatal Mortality Rates per 1,000 Births, by Race/Ethnicity and Abortion Policy, 2018–2020EXHIBIT 7Data: Mortality — Centers for Disease Control and Prevention, CDC WONDER (database), “Underlying Cause of Death, 1999–2020,” accessed Sept. 30, 2022; Perinatal mortality — Claudia P. Valenzuela, Elizabeth C.W. Gregory, and Joyce A. Martin, Decline in Perinatal Mortality in the United States, 2017–2019, NCHS Data Brief no. 429 (National Center for Health Statistics, Jan. 2022).Perinatal mortality (2019)Infant mortality (2018–2020)

8. Overall State Health System Performance, by Race and Abortion Policy (average percentile scores)EXHIBIT 8Note: Scores are weighted by state population and reflect performance across 24 measures in three domains: outcomes related to premature death; access to health insurance and providers; and quality and use of preventive services.Data: David C. Radley et al., Achieving Racial and Ethnic Equity in U.S. Health Care: A Scorecard of State Performance (Commonwealth Fund, Nov. 2021).

9. Source of Payment for Deliveries, 2020EXHIBIT 9Data: Centers for Disease Control and Prevention, CDC WONDER (database), “Natality, 2016–2020,” accessed Nov. 15, 2022.