PPT-1 Supplemental Figure S1
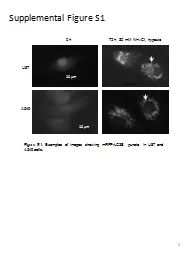
Figure S1 Examples of images showing mRFPLC3B puncta in U87 and A549 cells U87 72 h 30 mM NH 4 Cl hypoxia 0 h A549 20 μ m 20 μ m Supplemental Figure S2 A B Figure
Download Presentation
"1 Supplemental Figure S1" is the property of its rightful owner. Permission is granted to download and print materials on this website for personal, non-commercial use only, provided you retain all copyright notices. By downloading content from our website, you accept the terms of this agreement.
Presentation Transcript
Transcript not available.