/
Costliest Global Floods: Economic Loss Costliest Global Floods: Economic Loss

Costliest Global Floods: Economic Loss - PDF document

tatiana-dople
tatiana-dople . @tatiana-dople
Follow
403 views
Uploaded On 2017-03-29

Costliest Global Floods: Economic Loss - PPT Presentation

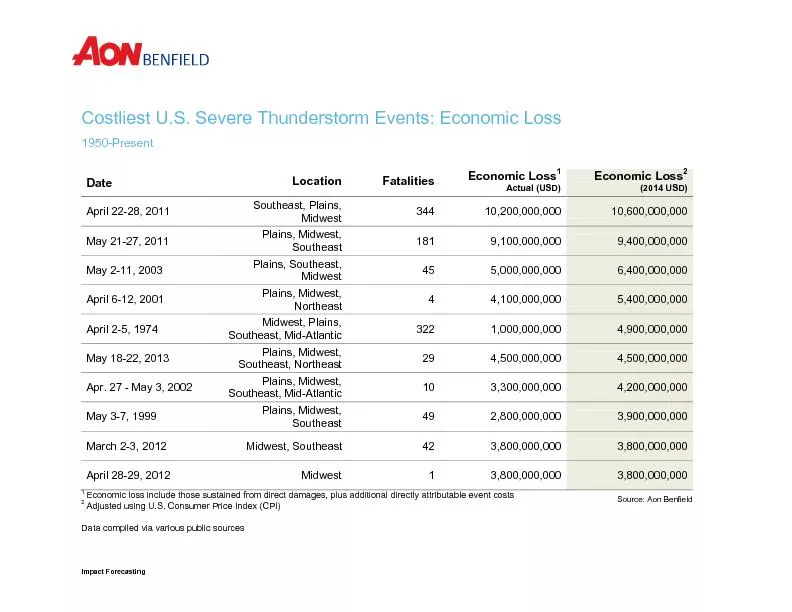
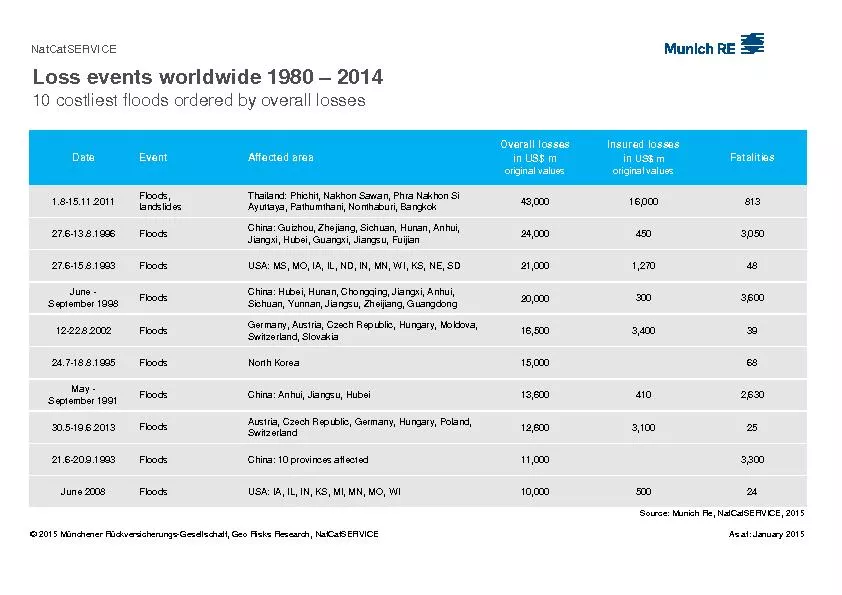
Economic Loss 1 Actual USD Economic Loss 2 201USD July December 2011Thailand45000000000 July August 1998China365630500000000 00000 June August 1993United States21000000000 00000000 D ID: 332237

Economic Loss 1 Actual (USD) Economic Loss 2 (201USD) July December 2011Thailand45 000 000 000 July

Share:

Link:

Embed:

Download Presentation from below link

Download Pdf The PPT/PDF document "Costliest Global Floods: Economic Loss" is the property of its rightful owner. Permission is granted to download and print the materials on this web site for personal, non-commercial use only, and to display it on your personal computer provided you do not modify the materials and that you retain all copyright notices contained in the materials. By downloading content from our website, you accept the terms of this agreement.


Presentation Transcript

Costliest Global Floods: Economic LossPresentEconomic lossinclude those sustained from direct damages, plus additional directly attributable event costsAdjusted using U.S. Consumer Price Index (CPI)Data Economic Loss 1 Actual (USD) Economic Loss 2 (201USD) July December 2011Thailand45,000,000,000 July August 1998China3,65630,500,000,000 00,000, June August 1993United States21,000,000,000 00,000,000 Dec. 2010 Jan. 2011Australia30,000,000,000 00,000,000 June July 1953Japan2,5663,200,000,000 27,9 July August 2010China25,000,000,000 00,000,000 August 2002Central Europe20,000,000,000 00,000,000 August September 1995North Korea15,000,000,000 00,000,000 May June 2013Central Europe00,000,000 00,000,000 June July China2,77512,600,000,000 19,000,000,000 Source: Aon Benfield ��Impact Forecasting Costliest Global Floods: Insured LossPresentInsured lossinclude those sustained by private insurers andgovernmentsponsored programsAdjusted using U.S. Consumer Price Index (CPI)Data compiled via various public sourcesDateLocationFatalities Insured Loss 1 Actual (USD) Insured Loss 2 (201USD) July December 2011Thailand15,500,000,000 00,000,000 August 2002Central Europe4,500,000,000 5,800,000,000 May June 2013Central Europe5,300,000,000 5,300,000,000 June July 2007UK, WesternEurope2,400,000,000 700,000,000 June 2008United States2,500,000,000 2,700,000,000 Dec. 2010 Jan. 2011Australia0,000,000 600,000,000 July 2007United Kingdom2,000,000,000 ,000,000 August 2005Central & Eastern Europe0,000,000 200,000,000 June August 1993United States1,300,000,000 2,000,000,000 June Canada00,000,000 00,000,000 Source: Aon Benfield ��Impact Forecasting