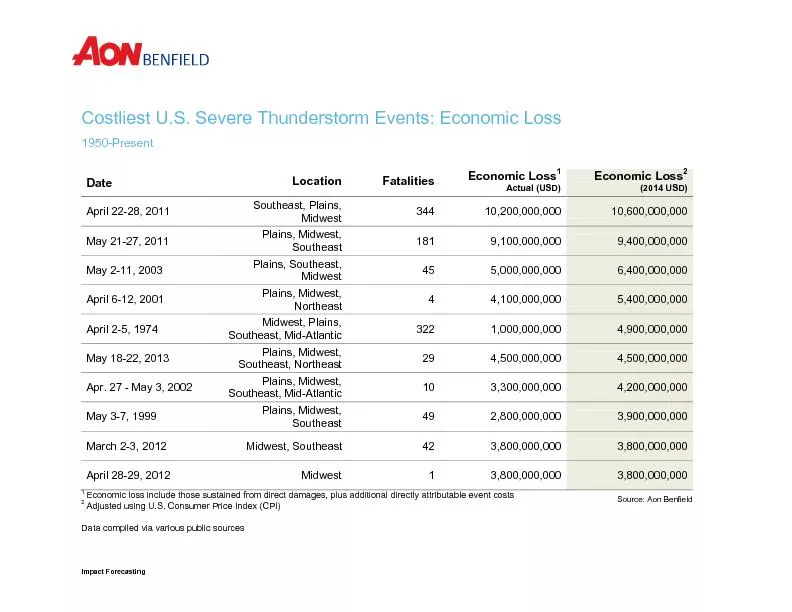
/
Costliest U.S. Severe Thunderstorm Events: Economic LossPresentEconomi Costliest U.S. Severe Thunderstorm Events: Economic LossPresentEconomi

Costliest U.S. Severe Thunderstorm Events: Economic LossPresentEconomi - PDF document

test
test . @test
Follow
416 views
Uploaded On 2016-05-24

Costliest U.S. Severe Thunderstorm Events: Economic LossPresentEconomi - PPT Presentation

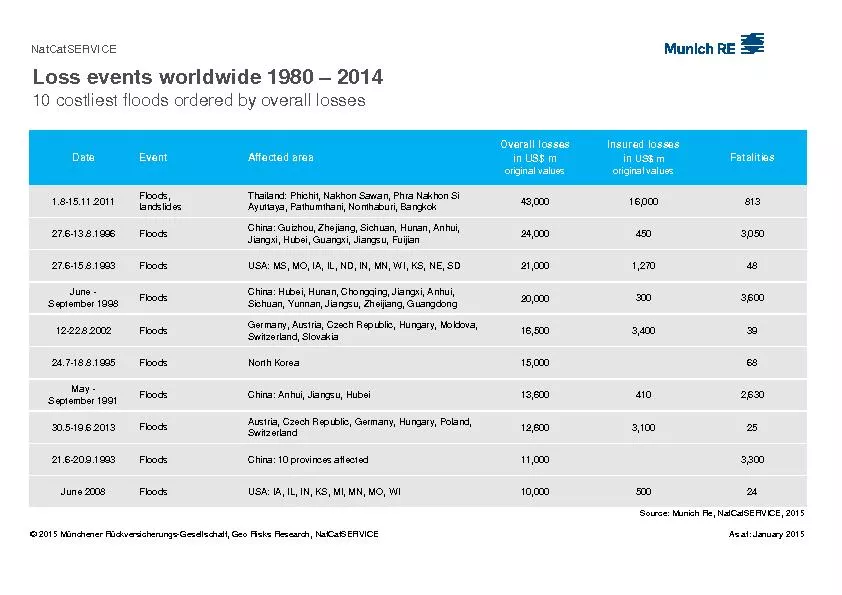
1 Actual USD Economic Loss 2 201USD April 2228 2011 Southeast Plains Midwest 10200000000 00000000 May 2127 2011Plains Midwest Southeast9100000000 400000000 May 211 2003Plains So ID: 332234

1 Actual (USD) Economic Loss 2 (201USD) April 2228 2011 Southeast Plains

Share:

Link:

Embed:

Download Presentation from below link

Download Pdf The PPT/PDF document "Costliest U.S. Severe Thunderstorm Event..." is the property of its rightful owner. Permission is granted to download and print the materials on this web site for personal, non-commercial use only, and to display it on your personal computer provided you do not modify the materials and that you retain all copyright notices contained in the materials. By downloading content from our website, you accept the terms of this agreement.


Presentation Transcript

Costliest U.S. Severe Thunderstorm Events: Economic LossPresentEconomic lossinclude those sustained from direct damages, plus additional directly attributable event costsAdjusted using U.S. Consumer Price Index (CPI)Data compiled via various public sourcesDateLocationFatalities 1 Actual (USD) Economic Loss 2 (201USD) April 2228, 2011 Southeast, Plains, Midwest 10,200,000,000 00,000,000 May 2127, 2011Plains, Midwest, Southeast9,100,000,000 400,000,000 May 211, 2003Plains, Southeast, Midwest5,000,000,000 00,000,000 April 612, 2001 Plains, Midwest, Northeast 4,100,000,000 00,000,000 April 25, 1974Midwest, Plains, Southeast, MidAtlanti1,000,000,000 4,9 May 1822, 2013Plains, Midwest, Southeast, Northeast4,500,000,000 4,500,000,000 Apr. 27 May 3, 2002 Plains, Midwest, Southeast, Mid - Atlantic 10 00,000,000 May 37, 1999Plains, Midwest, Southeast0,000,000 900,000,000 March 23, 2012Midwest, Southeast0,000,000 800,000,000 April 2829, 2012Midwest0,000,000 800,000,000 Source: Aon Benfield ��Impact Forecasting Costliest U.S. Severe Thunderstorm Events: Insured LossPresentInsuredlossinclude those sustained by private insurers and governmentsponsored programsAdjusted using U.S. Consumer Price Index (CPI)Data compiled via various public sourcesDateLocationFatalities Insured Loss 1 Actual (USD) Insured Loss 2 (201 April 2228, 2011 Southeast, Plains, Midwest 7,300,000,000 00,000,000 May 2127, 2011Plains, Midwest, Southeast0,000,000 00,000,000 May 211, 2003Plains, Southeast, Midwest3,200,000,000 100,000,000 April 612, 2001 Plains, Midwest, Northeast 2,200,000,000 900,000,000 October 56, 2010Arizona2,500,000,000 700,000,000 April 2829, 2012Midwest, Southeast2,400,000,000 00,000,000 March 23, 2012Midwest2,400,000,000 400,000,000 April 25, 1974Midwest, Plains, Southeast, MidAtlantic000,000 200,000,000 Apr. 27 May 3, 2002Plains, Midwest, Southeast, MidAtlantic,000,000 200,000,000 May 1226, 2010 Plains, Midwest, TN Valley, Northeast 2,000,000,000 2,100,000,000 Source: Aon Benfield ��Impact Forecasting