PPT-Impacts of Acute Warming on Arctic Flora and
Author : tatiana-dople | Published Date : 2016-07-16
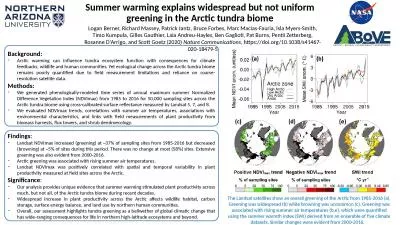
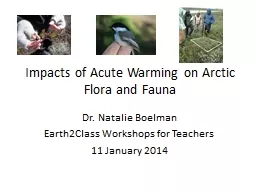
Fauna Dr Natalie Boelman Earth2Class Workshops for Teachers 11 January 2014 Dr Natalie Boelman httpwwwldeocolumbiaeduusernboelman Explores the cascade of changes
Presentation Embed Code
Download Presentation
Download Presentation The PPT/PDF document "Impacts of Acute Warming on Arctic Flora..." is the property of its rightful owner. Permission is granted to download and print the materials on this website for personal, non-commercial use only, and to display it on your personal computer provided you do not modify the materials and that you retain all copyright notices contained in the materials. By downloading content from our website, you accept the terms of this agreement.
Impacts of Acute Warming on Arctic Flora and: Transcript
Download Rules Of Document
"Impacts of Acute Warming on Arctic Flora and"The content belongs to its owner. You may download and print it for personal use, without modification, and keep all copyright notices. By downloading, you agree to these terms.
Related Documents