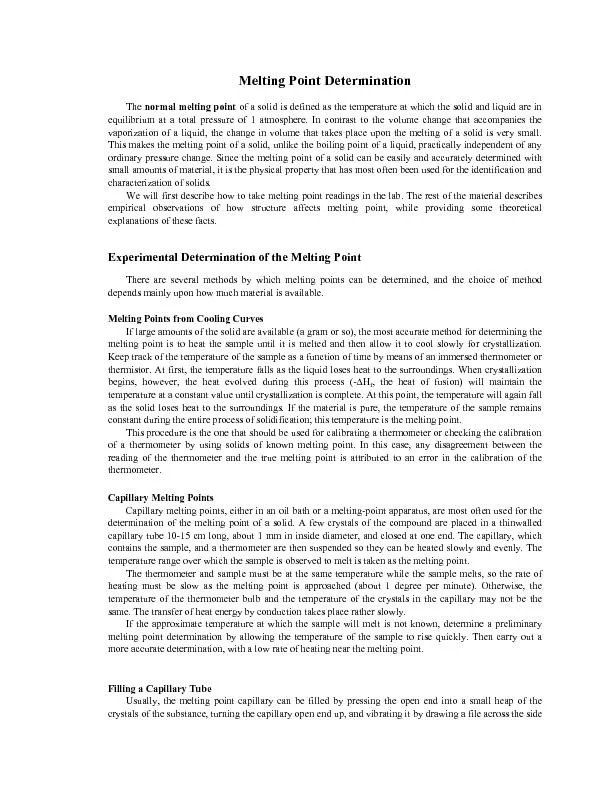
PDF-The normal melting point of a solid is defined as the temperature at w
Author : tatiana-dople | Published Date : 2017-02-10
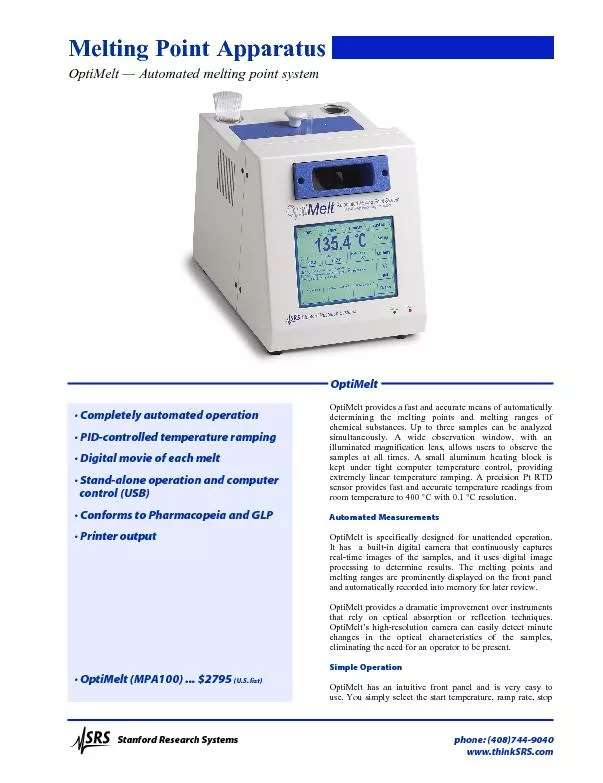
to rattle the crystals down into the bottom If filing does not work drop the tube open end up down a length of glass tubing about 1 cm in diameter or a long condenser
Presentation Embed Code
Download Presentation
Download Presentation The PPT/PDF document "The normal melting point of a solid is d..." is the property of its rightful owner. Permission is granted to download and print the materials on this website for personal, non-commercial use only, and to display it on your personal computer provided you do not modify the materials and that you retain all copyright notices contained in the materials. By downloading content from our website, you accept the terms of this agreement.
The normal melting point of a solid is defined as the temperature at w: Transcript
Download Rules Of Document
"The normal melting point of a solid is defined as the temperature at w"The content belongs to its owner. You may download and print it for personal use, without modification, and keep all copyright notices. By downloading, you agree to these terms.
Related Documents