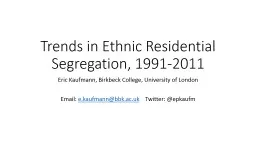
/
Trends in Ethnic Residential Segregation, 1991-2011 Trends in Ethnic Residential Segregation, 1991-2011

Trends in Ethnic Residential Segregation, 1991-2011 - PowerPoint Presentation

tatiana-dople
tatiana-dople . @tatiana-dople
Follow
414 views
Uploaded On 2016-11-20

Trends in Ethnic Residential Segregation, 1991-2011 - PPT Presentation

Eric Kaufmann Birkbeck College University of London Email ekaufmannbbkacuk Twitter epkaufm How did Ethnic Groups Move by Ethnic Neighbourhood Type 200111 Source R Johnston M ID: 491043

wards ethnic white british ethnic wards british white 2011 segregation minority source 2001 kaufmann quintile 1991 minorities change residential

Share:

Link:

Embed:

Download Presentation from below link

Download Presentation The PPT/PDF document "Trends in Ethnic Residential Segregation..." is the property of its rightful owner. Permission is granted to download and print the materials on this web site for personal, non-commercial use only, and to display it on your personal computer provided you do not modify the materials and that you retain all copyright notices contained in the materials. By downloading content from our website, you accept the terms of this agreement.


Presentation Transcript

Slide1

Trends in Ethnic Residential Segregation, 1991-2011

Eric Kaufmann, Birkbeck College, University of London

Email:

e.kaufmann@bbk.ac.uk

Twitter: @

epkaufmSlide2
Slide3
Slide4
Slide5
Slide6

How did Ethnic Groups Move?: by Ethnic Neighbourhood Type, 2001-11

Source: R. Johnston, M.

Poulsen

, J. Forrest, Multiethnic residential areas in a multiethnic country? A decade of major change in England and Wales,’

Environment and Planning A

2013, volume 45, pages 753 – 759Slide7
Slide8
Slide9
Slide10
Slide11
Slide12

USA 1970-2000

Source: data from Card

Mas

& Rothstein 2008

Source: Andersson

Hammarstedt

Neuman

2012Slide13

Source: Catney, G. 2013. ‘Has neighbourhood ethnic segregation decreased,’

Dynamics of Diversity: Evidence from the 2011 census

(JRF/Manchester: February),

ethnicity.ac.ukSlide14

Wards

% White

Quintile 1

6,722

94

%

Quintile 2

1,029

79

%

Quintile 3

406

58

%

Quintile 4

248

40

%

Quintile 5

166

21

%

Total

8850

82

Wards

% White

Quintile 1

7554

98

Quintile 2

726

87

Quintile 3

288

73

Quintile 4

180

57

Quintile 510234Total885091

2001

2011Slide15

Changes in Mutual Segregation (index of dissimilarity),

for Combinations of Groups, 1991-2001 and 2001-2011

Change in Segregation (ID), 1991-2011, England and Wales

White British-Minority little change

White British-individual minorities modest decline

Minority-minority largest declineSlide16

Conclusion

Minorities leave wards of ethnic concentration, often for

superdiverse

wardsWhite British move to relatively White British wards, avoiding both ethnic minority and

superdiverse

wards

Minorities spread, White British consolidate to produce stable picture

Declining single-group concentrations

Growing minority isolation from White British in diverse wardsSlide17

Trends in Ethnic Residential Segregation, 1991-2011

Eric Kaufmann, Birkbeck College, University of London

Email:

e.kaufmann@bbk.ac.uk Twitter: @epkaufm