PPT-A Dashboard of Macroeconomics Graphics for Extension Agribu
Author : tatyana-admore | Published Date : 2016-06-23
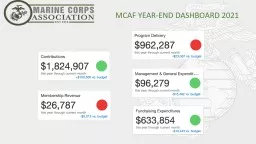
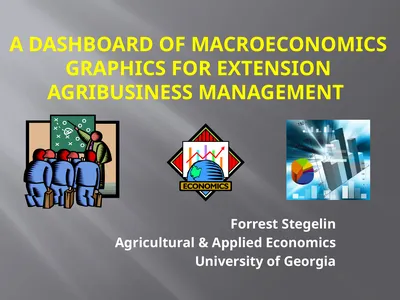
Forrest Stegelin Agricultural amp Applied Economics University of Georgia What is a dashboard In management information systems a dashboard is an easy to read often
Presentation Embed Code
Download Presentation
Download Presentation The PPT/PDF document "A Dashboard of Macroeconomics Graphics f..." is the property of its rightful owner. Permission is granted to download and print the materials on this website for personal, non-commercial use only, and to display it on your personal computer provided you do not modify the materials and that you retain all copyright notices contained in the materials. By downloading content from our website, you accept the terms of this agreement.
A Dashboard of Macroeconomics Graphics for Extension Agribu: Transcript
Download Rules Of Document
"A Dashboard of Macroeconomics Graphics for Extension Agribu"The content belongs to its owner. You may download and print it for personal use, without modification, and keep all copyright notices. By downloading, you agree to these terms.
Related Documents