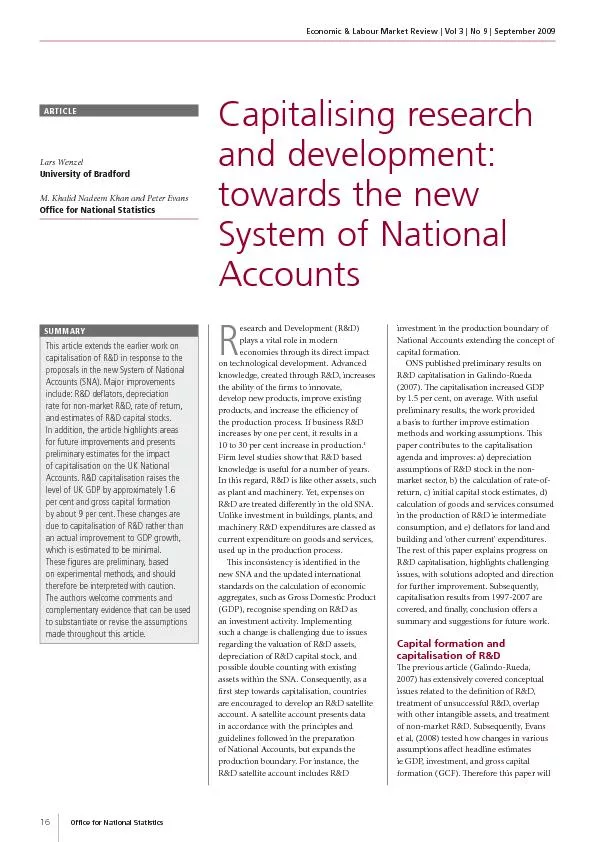
/
Capitalisation of R&D in national accounts Capitalisation of R&D in national accounts

Capitalisation of R&D in national accounts - PowerPoint Presentation

tatyana-admore
tatyana-admore . @tatyana-admore
Follow
390 views
Uploaded On 2017-12-02

Capitalisation of R&D in national accounts - PPT Presentation

a nd planned methodological work Presentation to NTTS satellite event Challenges in measuring productivity growth and intangibles 17 March 2017 Brussels Intangibles included in ESA 2010 ID: 611832

amp ipp data total ipp amp total data esa 2010 asset gfcf share software economic capital balance gross surveys

Share:

Link:

Embed:

Download Presentation from below link

Download Presentation The PPT/PDF document "Capitalisation of R&D in national ac..." is the property of its rightful owner. Permission is granted to download and print the materials on this web site for personal, non-commercial use only, and to display it on your personal computer provided you do not modify the materials and that you retain all copyright notices contained in the materials. By downloading content from our website, you accept the terms of this agreement.


Presentation Transcript

Slide1

Capitalisation of R&D in national accounts

a

nd

planned

methodological

work

Presentation

to NTTS satellite

event

"Challenges in

measuring

productivity

,

growth

and intangibles"

17 March 2017, BrusselsSlide2

Intangibles included in ESA 2010

Intellectual property products (IPP):

Research and development (new in ESA 2010)

Mineral exploration and evaluation

Computer software and databases

Entertainment

, literary or artistic

originals

Other

intellectual property

productsSlide3

Treatment of R&D

Commercial R&D: revenues from sales

Own-account R&D by enterprises:

Similar market prices

Sum of costs with mark-up

Own-account R&D by government, universities

etc

: sum of costs without mark-up

Production of R&D leads to an asset (an "original") that can be used directly in subsequent production or licensed to others.Slide4

Sources and methods for R&D

Manual on measuring R&D in ESA 2010:

"

Frascati

manual" surveys

Administrative data

Balance of payments

Business surveys

Capital expenditure surveys

Tax credit data

PatentsSlide5

ESA 2010 Data requirements

Quarterly: total economy gross fixed capital formation (GFCF) in total IPP

Annual:

Breakdown of GFCF by industry (max 64) and asset

Breakdown of

stocks (gross and net) by

industry (max 64) and

asset

Balance sheets for non-financial assets by sector

(not all breakdowns compulsory and derogations exist)Slide6

Some basic data

Average IPP

GFCF

in % of GDP: increase from 2.5% in 2000 to 3.3% in 2015

Share of R&D in total IPP: about 50%

Share of software in total IPP: between 35-40%

Average

stock

of IPP in % of total capital stock (gross): increase from 3.3% in 2000 to 4.5% in 2015

Share of R&D in total IPP:

between 60-65%

Share of software in total IPP: between

25-30

%Slide7
Slide8
Slide9
Slide10

Data improvements foreseen

Filling gaps in country coverage and time series

(some derogations are ending)

In-depth review of quality and comparability of GFCF in R&D

(in context of GNI Committee)Slide11

Eurostat/OECDTask Force on IPP 2017-2018

Develop further the practical guidance for estimating stocks and flows of IPP, in particular R&D

and software

Assess how economic location of IPP is/should be determined, in context of globalisation

Principle of economic ownershipSlide12

Longer-term developments

Next SNA/ESA: 202x?

SNA research agenda: broadening the fixed asset boundary to include other IPP (e.g. marketing assets)

European Task Force on future of ESA also put this issue on the agenda

Need to balance:

stability of methodology and quality of data

keeping up with economic trends and changing user needsSlide13

Thank you for your attention