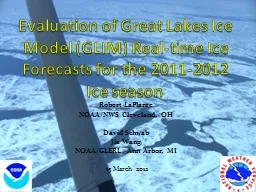
Robert LaPlante NOAANWS Cleveland OH David Schwab Jia Wang NOAAGLERL Ann Arbor MI 22 March 2011 Outline Description of the improved GLIM for the 20102011 ice season Comparison of the GLIM to the National Ice Center analysis ID: 296108
Download Presentation The PPT/PDF document "Evaluation of Great Lakes Ice Model (GLI..." is the property of its rightful owner. Permission is granted to download and print the materials on this web site for personal, non-commercial use only, and to display it on your personal computer provided you do not modify the materials and that you retain all copyright notices contained in the materials. By downloading content from our website, you accept the terms of this agreement.
Slide1
Evaluation of Great Lakes Ice Model (GLIM) Real-time Ice Forecasts for Lake Erie during the 2010-2011 Ice season
Robert LaPlanteNOAA/NWS Cleveland, OHDavid SchwabJia WangNOAA/GLERL Ann Arbor, MI 22 March 2011Slide2
Outline
Description of the improved GLIM for the 2010-2011 ice
seasonComparison of the GLIM to the National Ice Center analysisFuture plans for the GLIMMODIS 4-9 March 2010Slide3
Description of the GLIM
GLIM has been under development by
GLERL since 2007 GLIM is a combination of the Princeton Ocean Model for hydrodynamics and the Combined Ice Ocean Model tailored for the Great Lakes GLIM which has two modules, runs twice a day for Lake Erie as part of the Great Lakes Coastal Forecast system (GLCFS) at NOAA/GLERL at 2 km resolutionHourly
Nowcast runs - ingest surface meteorological and daily NIC ice concentration observationsForecast runs from 00 to 12o hours – driven by the NDFD
The
GLIM
is run using the latest surface forecast meteorological grids from the NWS National Digital Forecast Database (NDFD) out to 5 daysSlide4
Description of the GLIM
GLIM
Nowcasts of ice concentration are “nudged” towards the daily NIC ice concentration fieldThe initial conditions for the forecast module are based on nowcast runsModel output for the GLIM is posted to the web NWS CLE retrieves via ftp the GLIM for AWIPS and GFESlide5
GLIM New Nudge Procedure
GLIM
Nowcast nudging procedure added for 2010-2011 takes the GLIM ice concentration and “nudges” it close to the daily NIC ice concentration analysisIn grid cells where both NIC and GLIM are ice-free, no nudging is appliedIn grid cells where the NIC has ice, but the GLIM is ice-free, the GLIM ice thickness is set to a small value (1 mm) and the ice concentration is “nudged” toward the NICIn grid cells where the GLIM has a non-zero ice concentration, the GLIM concentration is nudged toward the NIC concentration, whether it is zero or non-zeroSlide6
GLIM New Nudge Procedure
The nudging
consists of changing the GLIM computed concentration by a fraction of the difference between the GLIM and NIC concentrationsThe fraction is adjustable and is set to allow the GLIM to become nearly equal to the NIC field over a period of 12 hoursSlide7
GLIM Ice Concentration is nudged toward the NIC ice concentration field which is updated dailySlide8
GLIM NOWCAST with NIC NUDGING
Lake Erie Mean Ice
Concentraton (%)Slide9
Integration of the GLIM and NDFD results in the
Forecast Generation of:
Surface Water TemperatureIce ConcentrationIce ThicknessIce Drifthttp://www.glerl.noaa.gov/res/glcfs/erie-ice.php?lake=e&type=F&hr=01For both the nowcast and forecast components of the GLIMSlide10
GLIM Ice Concentration in GFE(%)
72 Hr Forecast from 4 Mar 2011Slide11
GLIM zoomed for Western Lake Erie
Plenty of winter recreation near the islands of Lake Erie Slide12
GLIM Forecast via Google MapsSlide13
GLIM Forecast via Google MapsSlide14
Sources of Error in the
Ice Concentration ForecastError in the daily NIC ice concentration analysis NIC analysis data sources are lagged: ~00 and ~12 UTC RADARSAT passes & previous day ~18 UTC MODIS imagery and current day ~18 UTC MODIS imagery are combined and posted about 00 UTC the next day
Error in the NDFD parameters (wind, temperature, or dewpoint)Error in the GLIM: nudging procedure, vertical mixing, no wave mixingSlide15
Mean Ice Concentration
GLIM 1,3,5 Day FCST compared with NICSlide16
Day 1 Comparison
Change in GLIM MEAN Ice Concentration to NIC MEAN Ice Concentration Dec - MarSlide17
Day 3 Comparison
Change in GLIM MEAN Ice Concentration to NIC MEAN Ice Concentration Dec - MarSlide18
Day 5 Comparison
Change in GLIM MEAN Ice Concentration to NIC MEAN Ice Concentration Dec - Slide19
Bathymetry of Lake Erie (M)
22
6410Slide20
Comparison
of the GLIM to the NIC AnalysisBOIVerify
is a statistical analysis application that is run at many NWS offices to help verify locally produced gridded forecasts from the NDFD BOIVerify was modified at NWS CLE to ingest the GLERL GLIM forecasts of ice concentration and ice cover analysis from the National Ice Center (NIC) to help evaluate the GLIMSlide21
Ice Concentration Bias (%) 24 hour
GLIM- NIC 6-21 Jan 2011
Too little ice
forecast
Too much ice
forecastSlide22
Ice Concentration Bias (%) 48 hour
GLIM- NIC 6-21 Jan 2011
Too little ice
forecast
Too much ice
forecastSlide23
Ice Concentration Bias (%) 72 hour
GLIM- NIC 6-21 Jan 2011
Too much iceforecastToo little iceforecastSlide24
Ice Concentration Bias (%) 96 hour
GLIM- NIC 6-21 Jan 2011
Too little iceforecast
Too much ice
forecastSlide25
Ice Concentration Bias (%) 120 hour
GLIM- NIC 6-21 Jan 2011
Too little ice
forecast
Too much ice
forecastSlide26
Lake Erie Ice Drift 30 Jan- 15 Feb 2011
Persistent easterly drift of ice cover over the central basin of Lake ErieSlide27
Expected Value of the GLIM
vs NIC24 hr Fcst 6-21 Jan 2011
Observed = NICForecast = GLIMToo little IceFcstSlide28
Expected Value of the GLIM
vs NIC48 hr Fcst 6-21 Jan 2011
Observed = NICForecast = GLIMToo little IceFcstSlide29
Expected Value of the GLIM
vs NIC72 hr Fcst 6-21 Jan 2011
Observed = NICForecast = GLIMToo little IceFcstSlide30
Expected Value of the GLIM
vs NIC96 hr Fcst 6-21 Jan 2011
Observed = NICForecast = GLIMToo little IceFcstSlide31
Expected Value of the GLIM
vs NIC120 hr Fcst 6-21 Jan 2011
Observed = NICForecast = GLIMToo little IceFcstSlide32
Summary of the GLERL GLIM
2010-2011 ice season on Lake ErieGLIM nowcasts for 2010-2011 were more realistic with daily nudging from the NIC ice concentration analysis
GLIM 1-5 Day forecasts were more realistic with being initialized with better nowcastsDuring the rapid freeze up in January, the GLIM produced too little ice in the central basin and too much ice near Long PointTrends in changes in observed spatial coverage were better simulated this seasonDifficult to separate error in NDFD with error in GLIMSlide33
Future Plans for the GLIM
Upon evaluation the 2010-2011 ice season, the GLIM may be expanded to the other Great Lakes for the 2011-2012 ice seasonAdditional refinement of the GLIM is expected for the 2011-2012 ice season
Additional NDFD fields may be used by the GLIM – snowfall and QPF to make the model more realisticOutput from the GLIM may be added to the NDFDSlide34
Questions ?
Robert.laplante@noaa.gov