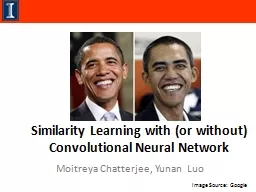
Moitreya Chatterjee Yunan Luo Image Source Google Outline This Section Why do we need Similarity Measures Metric Learning as a measure of Similarity Notion of a metric Unsupervised Metric Learning ID: 559719
Download Presentation The PPT/PDF document "Similarity Learning with (or without) Co..." is the property of its rightful owner. Permission is granted to download and print the materials on this web site for personal, non-commercial use only, and to display it on your personal computer provided you do not modify the materials and that you retain all copyright notices contained in the materials. By downloading content from our website, you accept the terms of this agreement.
Slide1
Similarity Learning with (or without) Convolutional Neural Network
Moitreya Chatterjee, Yunan Luo
Image Source: GoogleSlide2
Outline – This Section
Why do we need Similarity MeasuresMetric Learning as a measure of SimilarityNotion of a metricUnsupervised Metric LearningSupervised Metric Learning
Traditional Approaches for MatchingChallenges with Traditional Matching Techniques
Deep Learning as a Potential Solution
Application of Siamese Network for different tasksSlide3
Need for Similarity Measures
Image Source: Google, PyImageSearch
Several applications of Similarity Measures exists in today’s world:
Recognizing handwriting in checks.
Automatic detection of faces in a camera image.
Search Engines, such as Google, matching a
query
(could be text, image, etc.) with a set of
indexed documents
on the web. Slide4
Notion of a Metric
A
Metric
is a function that quantifies a “distance” between every pair of elements in a set, thus inducing a measure of similarity.
A metric f(
x,y
) must satisfy the following properties for all x, y, z belonging to the set:
Non-negativity
: f(x, y) ≥ 0
Identity of Discernible
: f(x, y) = 0 <=> x = y
Symmetry
: f(x, y) = f(y, x)
Triangle Inequality
: f(x, z) ≤ f(x, y) + f(y, z)Slide5
Types of Metrics
In broad strokes metrics are of two kinds:
Pre-defined
Metrics
: Metrics which are fully specified without the knowledge of data.
E.g. Euclidian
Distance:
f(
x
,
y
) = (
x
–
y
)
T
(
x
–
y
)
Learned Metrics
: Metrics which can only be defined with the
knowledge
of the
data
.
E.g. Mahalanobis Distance:
f(
x
,
y
) = (
x
-
y
)
T
M
(
x
-
y
)
; where
M
is a matrix that is estimated from the data.
Learned Metrics are of two types:
Unsupervised
: Use unlabeled data
Supervised
: Use labeled dataSlide6
UNSUPERVISED METRIC LEARNINGSlide7
Mahalanobis Distance
Mahalanobis
Distance weighs the Euclidian distance between two points, by the standard deviation of the data.
f(
x
,
y
) = (
x
-
y
)
T
∑
-1
(
x
-
y
)
; where
∑
is the mean-subtracted covariance matrix of all data points.
Chandra, M.P., 1936. On the
generalised
distance in statistics. In
Proceedings of the National Institute of Sciences of India
(Vol. 2, No. 1, pp. 49-55).
Image Source:
GoogleSlide8
SUPERVISED METRIC LEARNINGSlide9
Supervised Metric Learning
In this setting, we have access to
labeled
data samples
(
z = {x, y})
.
The typical strategy is to use a 2-step procedure:
Apply some
supervised
domain transform.
Then use one of the unsupervised metrics for performing the mapping.
Bellet
, A.,
Habrard
, A. and
Sebban
, M., 2013. A survey on metric learning for feature vectors and structured data.
arXiv
preprint arXiv:1306.6709
.
Image Source:
GoogleSlide10
Linear Discriminant Analysis (LDA)
In Fisher-LDA,
the goal is to project the data to a space such that the ratio of “
between class covariance
” to “
within class covariance
” is maximized.
This is given by: J(w) =
max
w
(
w
T
S
B
w
)/(
w
T
S
W
w
)
Fisher, R.A., 1936. The use of multiple measurements in taxonomic problems.
Annals of eugenics
,
7
(2), pp.179-188.
Image Source:
GoogleSlide11
TRADITIONAL MATCHING TECHNIQUESSlide12
Traditional Approaches for Matching
The traditional approach for matching images, relies on the following pipeline:
Extract Features
: For instance, color histograms of the input images.
Learn Similarity
: Use L
1
-norm on the features.
Stricker
, M.A. and
Orengo
, M., 1995, March. Similarity of color images. In
IS&T/SPIE's Symposium on Electronic Imaging: Science & Technology
(pp. 381-392). International Society for Optics and Photonics.Slide13
Challenges with Traditional Methods for Matching
The principal shortcoming of traditional metric learning based methods is that the
feature representation
of the data and the
metric
ar
e
not learned jointly
.Slide14
Outline – This Section
Why do we need Similarity MeasuresMetric Learning as a measure of SimilarityTraditional Approaches for Similarity Learning
Challenges with Traditional Similarity Measures
Deep Learning as a Potential SolutionSiamese NetworksArchitectures
Loss Function
Training Techniques
Application of Siamese Network to different tasksSlide15
Deep Learning to the Rescue!
CNNs can
jointly optimize
the representation of the input data conditioned on the “similarity” measure being used, aka end-to-end learning.
Image Source:
GoogleSlide16
Revisit the Problem
Input
:
Given a pair of input images, we want to know how “similar” they are to each other.
Output
:
The output can take a variety of forms:
Either a binary label, i.e. 0 (same) or 1 (different).
A
Real
number indicating how similar a pair of images are.Slide17
Typical Siamese CNN
Input
:
A pair of input signatures.
Output (Target)
:
A
label,
0
for
similar,
1
else
.
Bromley, J.,
Bentz
, J.W.,
Bottou
, L.,
Guyon
, I.,
LeCun
, Y., Moore, C.,
Säckinger
, E. and Shah, R., 1993. Signature Verification Using A "Siamese" Time Delay Neural Network.
IJPRAI
,
7
(4), pp.669-688.
Image Source:
Google
Share WeightsSlide18
SIAMESE CNN - ARCHITECTURESlide19
Standard architecture of Siamese CNN
||D(x
1
) – D(x
2
)||
2
Simo-Serra, E.,
Trulls
, E.,
Ferraz
, L., Kokkinos, I.,
Fua
, P. and Moreno-
Noguer
, F., 2015. Discriminative learning of deep
convolutional
feature point descriptors. In
Proceedings of the IEEE International Conference on Computer Vision
(pp. 118-126).Slide20
Popular Architecture Varieties
No one “architecture” fits all!
Design largely governed by what performs
well empirically on the task at hand.
Inputs are merged right at the onset
Inputs are first embedded independently, then merged.
Zagoruyko
, S. and
Komodakis
, N., 2015. Learning to compare image patches via
convolutional
neural networks. In
Proceedings of the IEEE Conference on Computer Vision and Pattern Recognition
(pp. 4353-4361).Slide21
TRIPLET NETWORK
Compare triplets in one go.
Check if the sample in the
topmost
channel, is more similar to the one in the
middle
or the one in the
bottom
.
Allows us to learn ranking between samples.
Siamese CNN – Variants
Vo, N.N. and Hays, J., 2016, October. Localizing and orienting street views using overhead imagery. In European Conference on Computer Vision (pp. 494-509
).
D
(f(A), f(B)) <
D
(f(A), f(C))
+
-Slide22
SIAMESE CNN – LOSS FUNCTIONSlide23
Siamese CNN – Loss Function
Chopra, S.,
Hadsell
, R. and
LeCun
, Y., 2005, June. Learning a similarity metric discriminatively, with application to face verification. In
Computer Vision and Pattern Recognition, 2005. CVPR 2005. IEEE Computer Society Conference on
(Vol. 1, pp. 539-546). IEEE.
Is there a problem with this formulation?
Yes.
The model could learn to embed every input to the same point, i.e. predict a
constant
as
output
.
In such a case, every pair of input would be categorized as a positive pair.Slide24
Siamese CNN – Loss Function
Chopra, S.,
Hadsell
, R. and
LeCun
, Y., 2005, June. Learning a similarity metric discriminatively, with application to face verification. In
Computer Vision and Pattern Recognition, 2005. CVPR 2005. IEEE Computer Society Conference on
(Vol. 1, pp. 539-546). IEEE.
The final loss is defined as :
L = ∑loss of positive pairs + ∑ loss of negative pairsSlide25
Siamese CNN – Loss Function
Bell, S. and
Bala
, K., 2015. Learning visual similarity for product design with
convolutional
neural networks.
ACM Transactions on Graphics (TOG)
,
34
(4), p.98.
We can use different loss functions for the two types of input pairs.
Typical
positive pair
(
x
p
,
x
q
) loss:
L(
x
p
,
x
q
) = ||
x
p
–
x
q
||
2
(Euclidian Loss)Slide26
Siamese CNN – Loss Function
Bell, S. and
Bala
, K., 2015. Learning visual similarity for product design with
convolutional
neural networks.
ACM Transactions on Graphics (TOG)
,
34
(4), p.98.
Typical
negative pair
(
x
n
,
x
q
) loss :
L(
x
n
,
x
q
) = max(0, m
2
- ||
x
n
–
x
q
||
2
)
(Hinge Loss)Slide27
Choices of Loss Function
Several choices for the Loss Functions are available. Choice depends on the task at hand.Loss Functions for
2-Stream Networks:
Margin Based: Contrastive Loss
: Loss(
x
p
, x
q
, y
) =
y * ||
x
p
-x
q
||
2
+ (1 –y) * max(0, m
2
- ||
x
p
-
x
q
||
2
)
Allows us to learn a margin of separation.
Extensible for Triplet Networks
Non-Margin Based:
Distance-Based Logistic Loss
:
P(
x
p
,
xq) = (1+ exp(-m) )/( 1+ exp(
||x
p
-
x
q
||
- m) )
Loss(
x
p
,
x
q
, y) =
LogLoss
(
P(
x
p
,
x
q
), y
)
Good for quicker convergence.Slide28
Choices of Loss Function
Contrastive Loss: For similar samples: Loss(x
p,
xq) =
||
x
p
-xq
||
2
Distance-Based Logistic Loss
:
For similar pairs
P(
x
p
,
x
q
) = (1+ exp(-m) )/( 1+ exp(
||
x
p
-
x
q
||
- m) )
-> 1 quickly
Loss(
x
p
,
x
q
, y) =
LogLoss
(
P(
xp
,
x
q
), y
)
Vo, N.N. and Hays, J., 2016, October. Localizing and orienting street views using overhead imagery. In European Conference on Computer Vision (pp. 494-509
).Slide29
SIAMESE CNN – TRAININGSlide30
Siamese CNN – Training
Update each of the two streams independently and then average the weights.
Does this technique remind us of anything?
Training in RNNs.
Data augmentation may be used for more effective training.
Typically we hallucinate more examples by performing random crops, image flipping, etc.
∂l/ ∂D(x
1
)
∂l/ ∂D(x
2
)Slide31
Outline – This Section
Why do we need Similarity MeasuresMetric Learning as a measure of SimilarityTraditional Approaches for Similarity Learning
Challenges with Traditional Similarity Measures
Deep Learning as a Potential SolutionApplication of Siamese Network to different tasks
Generating invariant and robust descriptors
Person Re-Identification
Rendering a street from Different Viewpoints
Newer nets for Person Re-Id, Viewpoint Invariance and Multimodal Data.Use of Siamese Networks for Sentence MatchingSlide32
APPLICATIONSSlide33
Discriminative Descriptors for Local Patches
Learn a discriminative representation of patches from different views of 3D pointsSimo-Serra, E., Trulls, E., Ferraz
, L., Kokkinos, I., Fua, P. and Moreno-Noguer
, F., 2015. Discriminative learning of deep convolutional feature point descriptors. In Proceedings of the IEEE International Conference on Computer Vision
(pp. 118-126).Slide34
Deep Descriptor
Use the CNN outputs of our Siamese networks as descriptor
Simo-Serra, E.,
Trulls
, E.,
Ferraz
, L., Kokkinos, I.,
Fua
, P. and Moreno-
Noguer
, F., 2015. Discriminative learning of deep
convolutional
feature point descriptors. In
Proceedings of the IEEE International Conference on Computer Vision
(pp. 118-126).Slide35
Evaluation
Simo-Serra, E., Trulls, E., Ferraz, L., Kokkinos, I., Fua, P. and Moreno-Noguer, F., 2015. Discriminative learning of deep convolutional feature point descriptors. In Proceedings of the IEEE International Conference on Computer Vision
(pp. 118-126).
Dataset
SIFT (Non-deep)
[23](Non-deep)
Ours
ND
0.346
0.663
0.667
TO
0.425
0.709
0.545
LY
0.226
0.558
0.608
All
0.370
0.693
0.756
Comparison of area under precision-recall curve
SIFT: hand-crafted features
[23]: descriptor via convex optimization
Robustness to Rotation
SIFT
Ours
[23]Slide36
Person Re-Identification
CUHK03 DatasetSlide37
Quick Test
Ahmed, E., Jones, M. and Marks, T.K., 2015. An improved deep learning architecture for person re-identification. In Proceedings of the IEEE Conference on Computer Vision and Pattern Recognition (pp. 3908-3916).Are they the same person?Slide38
Person Re-Identification
True positiveTrue negativeAhmed, E., Jones, M. and Marks, T.K., 2015. An improved deep learning architecture for person re-identification. In
Proceedings of the IEEE Conference on Computer Vision and Pattern Recognition (pp. 3908-3916).Slide39
Proposed Architecture
Ahmed, E., Jones, M. and Marks, T.K., 2015. An improved deep learning architecture for person re-identification. In Proceedings of the IEEE Conference on Computer Vision and Pattern Recognition
(pp. 3908-3916).Slide40
Proposed Architecture
Ahmed, E., Jones, M. and Marks, T.K., 2015. An improved deep learning architecture for person re-identification. In
Proceedings of the IEEE Conference on Computer Vision and Pattern Recognition
(pp. 3908-3916).Slide41
Proposed Architecture
CNN
CNN
Ahmed, E., Jones, M. and Marks, T.K., 2015. An improved deep learning architecture for person re-identification. In
Proceedings of the IEEE Conference on Computer Vision and Pattern Recognition
(pp. 3908-3916).Slide42
Proposed Architecture
CNN
Loss
CNN
Ahmed, E., Jones, M. and Marks, T.K., 2015. An improved deep learning architecture for person re-identification. In
Proceedings of the IEEE Conference on Computer Vision and Pattern Recognition
(pp. 3908-3916).Slide43
Tied Convolution
Use
convolutional layers to compute higher-order features
Shared weights
Ahmed, E., Jones, M. and Marks, T.K., 2015. An improved deep learning architecture for person re-identification. In
Proceedings of the IEEE Conference on Computer Vision and Pattern Recognition
(pp. 3908-3916).Slide44
Cross-Input Neighborhood Differences
Compute
neighborhood difference
of two
feature maps
, instead of elementwise difference.
5
7
2
1
4
2
3
4
4
f
g
1
4
1
2
3
5
1
2
3
Example:
f, g
are feature maps of two input images
Ahmed, E., Jones, M. and Marks, T.K., 2015. An improved deep learning architecture for person re-identification. In
Proceedings of the IEEE Conference on Computer Vision and Pattern Recognition
(pp. 3908-3916).Slide45
Cross-Input Neighborhood Differences
Compute
neighborhood difference
of two
feature maps
, instead of elementwise difference.
5
7
2
1
4
2
3
4
4
f
g
1
4
1
2
3
5
1
2
3
K(1,1) =
5
5
5
5
1
4
2
3
-
=
4
4
3
2
Example:
f, g
are feature maps of two input images
Ahmed, E., Jones, M. and Marks, T.K., 2015. An improved deep learning architecture for person re-identification. In
Proceedings of the IEEE Conference on Computer Vision and Pattern Recognition
(pp. 3908-3916).Slide46
Cross-Input Neighborhood Differences
Compute
neighborhood difference
of two
feature maps
, instead of elementwise difference.
A neighborhood-patch size of 5 was used in the paper:
Another neighborhood difference map
K’
was also computed where
f
and
g
were revised.
K
i
(
x,y
)=f
i
(
x,y
)I(5,5)-N[
g
i
(
x,y
)]
w
here
I(5,5)
is a 5x5 matrix of 1s
,
N[
g
i
(
x,y
)]
is the 5x5 neighborhood of
g
i
centered at
(
x,y
)Slide47
Patch Summary Features
Convolutional layers with 5x5 filters and stride 5 (the size of neighborhood patch).
Provides a high-level summary of the cross-input differences in a neighborhood patch.
Ahmed, E., Jones, M. and Marks, T.K., 2015. An improved deep learning architecture for person re-identification. In
Proceedings of the IEEE Conference on Computer Vision and Pattern Recognition
(pp. 3908-3916).Slide48
Across-Patch Features
Convolutional layers with 3x3 filters and stride 1.
Learn spatial relationships across neighborhood differences
Ahmed, E., Jones, M. and Marks, T.K., 2015. An improved deep learning architecture for person re-identification. In
Proceedings of the IEEE Conference on Computer Vision and Pattern Recognition
(pp. 3908-3916).Slide49
Across-Patch Features
Fully connected layer.
Combine information from patches that are far from each other.
Output: 2
softmax
units
Ahmed, E., Jones, M. and Marks, T.K., 2015. An improved deep learning architecture for person re-identification. In
Proceedings of the IEEE Conference on Computer Vision and Pattern Recognition
(pp. 3908-3916).Slide50
Visualization of Learned Features
Ahmed, E., Jones, M. and Marks, T.K., 2015. An improved deep learning architecture for person re-identification. In Proceedings of the IEEE Conference on Computer Vision and Pattern Recognition (pp. 3908-3916).Slide51
Evaluation
Method
Elementwise Difference
Neighborhood Difference
Identification rate
27.66%
54.74%
Method
Regular Siamese
Network
This work
Identification rate
42.19%
54.74%Slide52
Street-View to Overhead-View Image Matching
Vo, N.N. and Hays, J., 2016, October. Localizing and orienting street views using overhead imagery. In European Conference on Computer Vision (pp. 494-509).Slide53
Street-View to Overhead-View Image Matching
Vo, N.N. and Hays, J., 2016, October. Localizing and orienting street views using overhead imagery. In European Conference on Computer Vision (pp. 494-509).Query:MatchingImage:Slide54
Quick Test
Vo, N.N. and Hays, J., 2016, October. Localizing and orienting street views using overhead imagery. In European Conference on Computer Vision (pp. 494-509).
Query Image
Which one is the correct match?
A
B
C
D
ESlide55
CNN Architectures
Classification CNN:
I = concatenation(A, B)
f =
AlexNet
l = {0, 1}, label
L(A, B, l) =
LogLossSoftMax
(f(I), l)
Vo, N.N. and Hays, J., 2016, October. Localizing and orienting street views using overhead imagery. In European Conference on Computer Vision (pp. 494-509
).Slide56
CNN Architectures
Classification CNN:
Siamese-like CNN:
I = concatenation(A, B)
f =
AlexNet
l = {0, 1}, label
D = ||f(A) – f(B)||
2
m = margin parameter
L(A, B, l) =
LogLossSoftMax
(f(I), l)
L(A, B, l) = l * D + (1- l) * max(0, m – D)
Vo, N.N. and Hays, J., 2016, October. Localizing and orienting street views using overhead imagery. In European Conference on Computer Vision (pp. 494-509
).Slide57
CNN Architectures
Classification CNN:
Siamese-like CNN:
Siamese-classification hybrid network:
I = concatenation(A, B)
f =
AlexNet
l = {0, 1}, label
D = ||f(A) – f(B)||
2
m = margin parameter
I
conv
= concatenation(
f
conv
(A),
f
conv
(B))
L(A, B, l) =
LogLossSoftMax
(f(I), l)
L(A, B, l) =
LogLossSoftMax
(
f
fc
(
I
conv
), l)
L(A, B, l) = l * D + (1- l) * max(0, m – D)
Vo, N.N. and Hays, J., 2016, October. Localizing and orienting street views using overhead imagery. In European Conference on Computer Vision (pp. 494-509
).Slide58
CNN Architectures
Classification CNN:
Siamese-like CNN:
Siamese-classification hybrid network:
Triplet network CNN:
I = concatenation(A, B)
f =
AlexNet
l = {0, 1}, label
D = ||f(A) – f(B)||
2
m = margin parameter
(A, B) is a match pair
(A, C) is a non-match pair
I
conv
= concatenation(
f
conv
(A),
f
conv
(B))
L(A, B, l) =
LogLossSoftMax
(f(I), l)
L(A, B, l) =
LogLossSoftMax
(
f
fc
(
I
conv
), l)
L(A, B, l) = l * D + (1- l) * max(0, m – D)
L(A, B, C) = max(0, m + D(A, B) – D(A, C))
Vo, N.N. and Hays, J., 2016, October. Localizing and orienting street views using overhead imagery. In European Conference on Computer Vision (pp. 494-509
).Slide59
Distance-based Logistic Loss
Matched/Nonmatched instances are pushed away from the “boundary” in the
inward/outward
direction.
L(A, B, l) =
LogLoss
(p(A, B),
l)
where
D = ||f(A) – f(B)||
2
m = margin parameterSlide60
Performance of Different Networks
Vo, N.N. and Hays, J., 2016, October. Localizing and orienting street views using overhead imagery. In European Conference on Computer Vision (pp. 494-509).
Siamese-like CNN:
Triplet network CNN:
Test set
Denver
Detroit
Seattle
Siamese
85.6
83.2
82.9
Triplet
88.8
86.8
86.4
Matching accuracy
Observation 1
:
Triplet network outperforms the Siamese by a large marginSlide61
Performance of Different Networks
Vo, N.N. and Hays, J., 2016, October. Localizing and orienting street views using overhead imagery. In European Conference on Computer Vision (pp. 494-509).
Siamese-like CNN:
Triplet network CNN:
Test set
Denver
Detroit
Seattle
Siamese
85.6
83.2
82.9
Siamese-DBL
90.0
88.0
88
Triplet
88.8
86.8
86.4
Triplet-DBL
90.2
88.4
87.6
Matching accuracy
Observation 2
:
Distance-based
logistic (DBL) Nets
significantly outperform the original network.
L(A, B, l) =
LogLoss
(p(A, B),
l)
Distance-based logistic (DBL) loss:Slide62
Performance of Different Networks
Vo, N.N. and Hays, J., 2016, October. Localizing and orienting street views using overhead imagery. In European Conference on Computer Vision (pp. 494-509).
Siamese-like CNN:
Triplet network CNN:
Test set
Denver
Detroit
Seattle
Siamese Net
85.6
83.2
82.9
Triplet Net
88.8
86.8
86.4
Classification Net
90.0
87.8
87.7
Hybrid Net
91.5
88.7
89.4
Classification CNN:
Classification-
siamese
hybrid:
Observation 3
:
Classification networks achieved better accuracy than Siamese and triplet networks.
Jointly extract and exchange information from both input images.
Matching accuracySlide63
MORE VARIANTS OF SIAMESE CNNsSlide64
Siamese CNN – Variants
SIAMESE CNN – INTERMEDIATE MERGING
Subramaniam
, A., Chatterjee, M. and Mittal, A., 2016. Deep Neural Networks with Inexact Matching for Person Re-Identification. In
Advances in Neural Information Processing Systems
(pp. 2667-2675).
Combining at an
intermediate stage
allows us to capture patch-level variability.
Performing inexact (soft) matching yields superior performance.
Match(X, Y) = (X-
μ
X
)(Y-
μ
Y
)/
σ
X
σ
YSlide65
Siamese CNN – Variants
SIAMESE CNN – INTERMEDIATE MERGING
Subramaniam
, A., Chatterjee, M. and Mittal, A., 2016. Deep Neural Networks with Inexact Matching for Person Re-Identification. In
Advances in Neural Information Processing Systems
(pp. 2667-2675).
Results:
Handling Partial Occlusion:
Baseline:
Proposed
Method:Slide66
Siamese CNN – Variants
SIAMESE CNN – FOR VIEWPOINT INVARIANCE
Kan, M., Shan, S. and Chen, X., 2016. Multi-view deep network for cross-view classification. In
Proceedings of the IEEE Conference on Computer Vision and Pattern Recognition
(pp. 4847-4855).
Viewpoint
invariance is incorporated by considering the similarity of response across the individual streams.Slide67
Siamese CNN – Variants
SIAMESE CNN – FOR VIEWPOINT INVARIANCE
Kan, M., Shan, S. and Chen, X., 2016. Multi-view deep network for cross-view classification. In
Proceedings of the IEEE Conference on Computer Vision and Pattern Recognition
(pp. 4847-4855).
Results on the CMU
MultiPIE
Dataset, for recognition across 7 poses.
Methods
-45 deg
-30 deg
-15 deg
15deg
30 deg
45 deg
CCA
0.73
0.96
1.00
0.99
0.96
0.69
KCCA (RBF)
0.80
0.98
0.99
1.00
0.98
0.72
FIP+LDA
0.93
0.96
1.00
0.99
0.96
0.90
MVP+LDA
0.93
1.00
1.00
1.00
0.99
0.96
Proposed
0.99
0.99
1.00
1.00
0.99
0.98Slide68
Siamese CNN – Variants
TWO STREAM CNN – FOR CROSS-MODAL EMBEDDING
Wang, L., Li, Y. and
Lazebnik
, S., 2016. Learning deep structure-preserving image-text embeddings. In
Proceedings of the IEEE Conference on Computer Vision and Pattern Recognition
(pp. 5005-5013).
Two stream networks have also been used for cross-modal embedding tasks. Here inputs from different modalities are mapped to a common space.
Man in black shirt playing a guitarSlide69
Siamese CNN - Variants
Hu, Baotian, et al., Convolutional neural network architectures for matching natural language sentences, NIPS 2014
Example:
x :
Damn, I have to work
overtime this
weekend
!
y
+
: Try to have some rest buddy
.
y
-
: It is hard to find a job, better start polishing your resume
.
Application: Sentence completion, response
to tweet, paraphrase
identification
word2vecSlide70
DEMO OF SIAMESE NETWORKSlide71
Demo: Architecture
FC3
(2 units)
Loss
(contrastive loss)
FC2
(1024 units)
FC1
(1024 units)
Code: @
ywpkwon
MNIST Digit Similarity AssessmentSlide72
Demo: Results
1
3
0
Code: @
ywpkwonSlide73
Summary
Quantifying “similarity” is an essential component of data analytics.Deep Learning approaches, such as “Siamese” Convolution Neural Nets, have shown promise recently. Several variants of Siamese CNN are available for making our life easier for a variety of tasks.Slide74
Reading List
Bell, Sean, and Kavita Bala, Learning visual similarity for product design with convolutional neural networks, ACM Transactions on Graphics (TOG), 2015
Chopra, Sumit, Raia
Hadsell, and Yann LeCun, Learning a similarity metric discriminatively, with application to face verification
, CVPR
2005
Zagoruyko
, Sergey, and Nikos Komodakis, Learning to compare image patches via convolutional neural networks
, CVPR
2015
Hoffer,
Elad
, and
Nir
Ailon
,
Deep metric learning using triplet network
,
arXiv:1412.6622
Simo-Serra, Edgar, et al.,
Discriminative Learning of Deep Convolutional Feature Point Descriptors
, ICCV
2015
Vo
, Nam N., and James Hays,
Localizing and Orienting Street Views Using Overhead Imagery
, ECCV
2016
Ahmed,
Ejaz
, Michael Jones, and Tim K. Marks,
An Improved Deep Learning Architecture for Person Re-Identification
, CVPR
2015
Hu,
Baotian
, et al.,
Convolutional neural network architectures for matching natural language sentences, NIPS 2014Kulis, Brian, Metric learning: A survey, Foundations and Trends in Machine Learning, 2013Su, Hang, et al., Multi-view convolutional neural networks for 3d shape recognition, ICCV 2015Zheng, Yi, et al., Time Series Classification Using Multi-Channels Deep Convolutional Neural Networks, WAIM 2014Yi, Kwang Moo, et al.,
LIFT: Learned Invariant Feature Transform, arXiv:1603.09114Stricker, M.A. and Orengo, M. Similarity of color images
. In IS&T/SPIE's Symposium on Electronic Imaging: Science & Technology (pp. 381-392), 1995.Slide75
Appreciate your kind attention!