/
Tropical Pacific Ocean forcing of the Tropical Pacific Ocean forcing of the

Tropical Pacific Ocean forcing of the - PowerPoint Presentation

tatyana-admore
tatyana-admore . @tatyana-admore
Follow
391 views
Uploaded On 2017-05-06

Tropical Pacific Ocean forcing of the - PPT Presentation

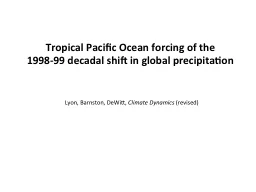
1998 99 decadal shift in global precipitation Lyon Barnston DeWitt Climate Dynamics revised MAM 2011 PRCP Anomaly MAM 19992011 AVG PRCP Anomaly East Africa MAM PRCP Anomaly ID: 545354

prcp mam 1999 pacific mam prcp pacific 1999 1998 africa poga east model 1979 2012 2011 anomalies anomaly eof1 pcs climate full

Share:

Link:

Embed:

Download Presentation from below link

Download Presentation The PPT/PDF document "Tropical Pacific Ocean forcing of the" is the property of its rightful owner. Permission is granted to download and print the materials on this web site for personal, non-commercial use only, and to display it on your personal computer provided you do not modify the materials and that you retain all copyright notices contained in the materials. By downloading content from our website, you accept the terms of this agreement.


Presentation Transcript

Slide1

Tropical Pacific Ocean forcing of the 1998-99 decadal shift in global precipitation

Lyon,

Barnston

, DeWitt,

Climate Dynamics

(revised)Slide2

MAM 2011PRCP Anomaly

MAM 1999-2011

AVG PRCP Anomaly

East Africa

MAM PRCP AnomalySlide3

MAM Avg. SST Anomaly1999-2012

MAM Avg. PRCP, V850

Anomalies 1999-2012

CMAP PRCP > 6 mm/day

Red

 1979-1998

Blue 1999-2011Slide4

1st EOF Loadings

MAM PRCP 1979-2011

PC1Slide5

Linearly remove ENSO and GWSignals from ERSST (and HAD SST):

Compute EOF of Residual Anomalies

EOF1 Pacific Domain

EOF1 Indo-Pacific Domain

PCs and GW TrendSlide6

GPCC PRCP Difference:(1999-2010) minus (1977-1998)

(1946-1976) minus (1977-1998)

Statistically Significant Pooled

PRCP Anomalies Slide7

EOF1 of R2 850hPa Wind for MAM1979-2012

As Above but for 20CR

(1930-2008)

PCsSlide8

R2 Composite 200hPa Stationary Wave for MAM

1999-2012

EOF1 of R2 200

hPa

Stationary Waves for MAM

1979-2012

PC1Slide9

Do Climate Model Simulations Capture the Recent Observed Patterns and the Shift?

Use the ECHAM4.5 (captures

climo

, used in IRI

fcsts

)

Full Simulations

POGA Runs (with slab ocean model)Slide10

PRCP Anomalies: (1999-2011) minus (1979-1998)

Full Simulation

POGASlide11

Model PRCP Leading EOFs

Full Simulation

POGA

PCsSlide12

EOFs of Model 850 hPa Wind Field

Full Simulation

POGA

PCsSlide13

Composite and EOF of Model 200 hPa Stationary Waves

POGA Composite

1999-2011

POGA EOF1

Loadings

PCSlide14

ConclusionsA climate shift akin to that of 1976-77 occurred in 1998-99

Shift is identified in multiple observational fields (PRCP, V850, SW200)

ECHAM4.5 simulations and POGA runs capture the salient, observed

features quite well

POGA runs are able to capture observed features, indicting the fundamental role

played by the tropical Pacific SSTs in generating

teleconnections

For East Africa, results strongly suggest that

multidecadal

variability in the

Pacific is the main driver of the recent “long rains” decline

- - - - - - - - - - - - - - - - - - - - - - - - - -

Interesting that in MAM the Pacific has direct relationship to East Africa

rainfall, vis-à-vis OND, when the progression is Pacific

 Indian  East Africa. Why?

What are the

physical mechanisms

that lead to the rainfall decline in East Africa?

Are there additional factors leading to the severity of recent MAM droughts in EA?

Climate Change  A wetter East Africa? What do the models get right (now)?